Hi, what do you want to do?
Texas Instruments
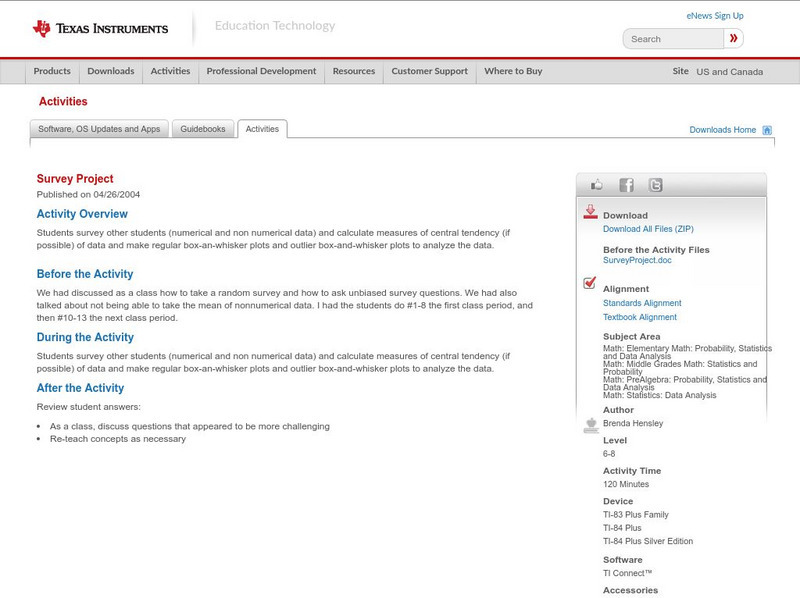
Texas Instruments: Survey Project
Students survey other students (numerical and non numerical data) and calculate measures of central tendency (if possible) of data and make regular box-an-whisker plots and outlier box-and-whisker plots to analyze the data.
Khan Academy
Khan Academy: Unit: Modeling Data Distributions
A complete unit with tutorials, text, and practice over modeling data distributions.
Other
Correlation Coefficients
This page provides a good discussion of correlation coefficients (r,) which indicate the "strength of the linear association between variables." Includes formulas and scatter plots. Some prior knowledge of statistics might be helpful.
Other
Estadistica
In Spanish. Overview of statistics and related concepts. Gives explanations, sample formulas and examples, as well as exercises for students to try (with link to solutions.)
Scientific American
Scientific American: Smart People Believe Weird Things
This article, published by Scientific American (September 2002), explores how smart people can believe weird and silly things. The article comes to the conclusion that our beliefs are shaped more by our environment than our understanding...
ClassFlow
Class Flow: Donkey Derby Handling Data
[Free Registration/Login Required] Can you list all probabilities when two dice are thrown? Run your own race here and see which donkey wins.
That Quiz
That Quiz: Probabilidad
Test your knowledge of probability by taking this practice test. Five levels are provided and it also tracks the number of correct and wrong answers.
University of Georgia
University of Georgia: Inter Math: Dependent Events
This site gives a description of dependent events along with an example. Be sure to follow the links to related terms, everyday examples, challenging problems, more information, and the interactive check point involving dependent events...
University of Colorado
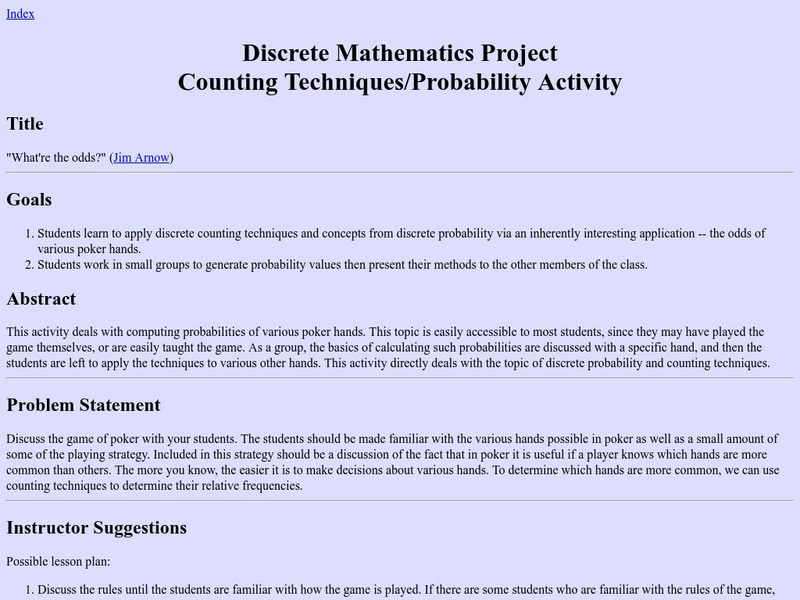
University of Colorado: Discrete Mathematics Project: What're the Odds?
This is an activity that may be instructive when trying to learn the concept of "odds" and how they are found.
PBS
Pbs Teachers: Whirlybirds [Pdf]
Predict and determine the frequency of an event and measure to the nearest centimeter while constructing whirlybirds in a simulation of a parachute jump competition.
Khan Academy
Khan Academy: Subsets of Sample Spaces
Answer interesting questions about subsets of sample spaces. Students receive immediate feedback and have the opportunity to try questions repeatedly, watch a video or receive hints.
Khan Academy
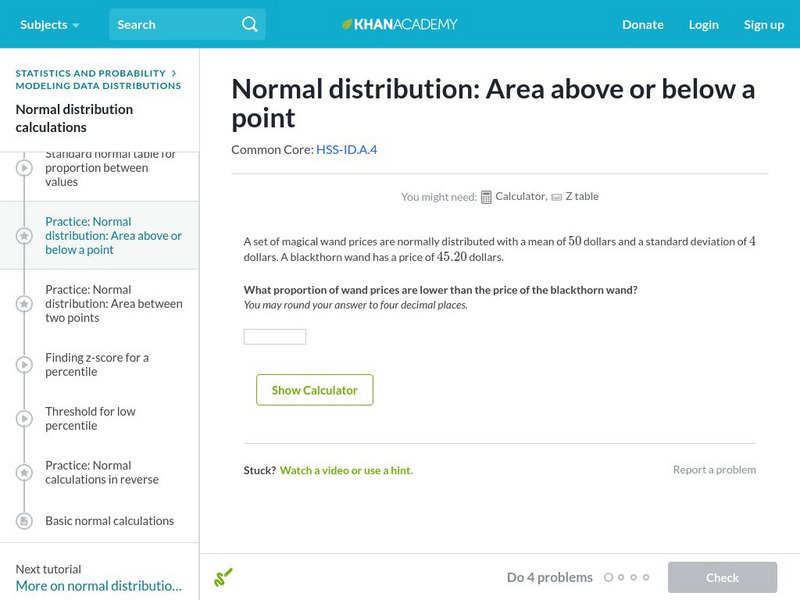
Khan Academy: Normal Distribution: Area Above or Below a Point
Use a z-table to find the probability of a particular measurement. Students receive immediate feedback and have the opportunity to try questions repeatedly, watch a video or receive hints.
Khan Academy
Khan Academy: Basic Set Notation
Checks understanding of the union, complement, and intersection of sets. Students receive immediate feedback and have the opportunity to try questions repeatedly, watch a video or receive hints.
Khan Academy
Khan Academy: Normal Distributions Review
Normal distributions come up time and time again in statistics. A normal distribution has some interesting properties: it has a bell shape, the mean and median are equal, and 68% of the data falls within 1 standard deviation.
Khan Academy
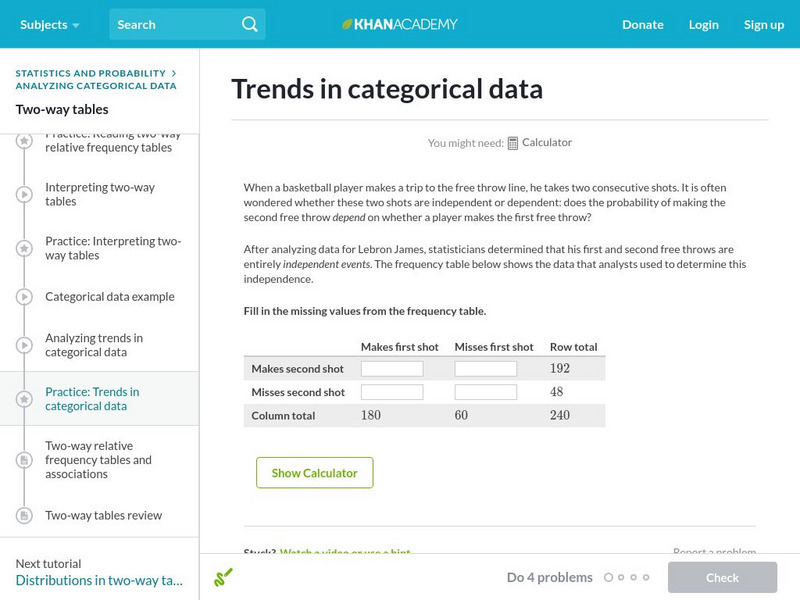
Khan Academy: Trends in Categorical Data
Analyze categorical data to find some trends. Students receive immediate feedback and have the opportunity to try questions repeatedly, watch a video or receive hints.
Khan Academy
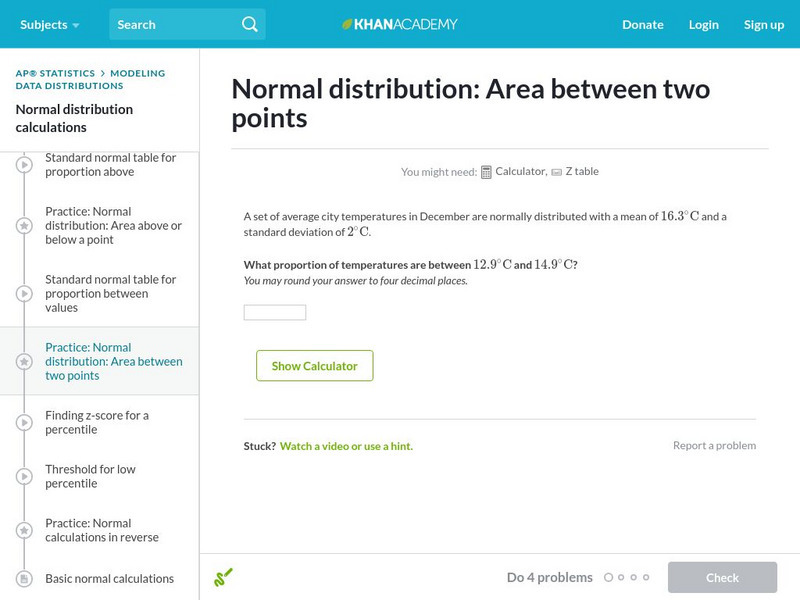
Khan Academy: Normal Distribution: Area Between Two Points
Use a z-table to find the probability that a particular measurement is in a range. Students receive immediate feedback and have the opportunity to try questions repeatedly, watch a video or receive hints.
Khan Academy
Khan Academy: Picture Graphs (Pictographs) Review
Picture graphs are a fun way to display data. This article reviews how to create and read picture graphs (also called pictographs).
Khan Academy
Khan Academy: Bar Graphs Review
Bar graphs are a nice way to visualize categorical data. This article reviews how to create and read bar graphs.
Khan Academy
Khan Academy: Correlation Coefficient Review
The correlation coefficient r measures the direction and strength of a linear relationship. Calculating r is pretty complex, so we usually rely on technology for the computations. We focus on understanding what r says about a scatterplot.
Khan Academy
Khan Academy: Median & Range Puzzlers
These conceptual problems really make you think! Getting through this exercise will deepen your understanding of median, range, and data sets in general. Students receive immediate feedback and have the opportunity to try questions...
National Council of Teachers of Mathematics
Nctm: Figure This: Math Challenges for Families
Students, teachers, and parents alike will enjoy this challenging math site. It contains a clever brain teaser section plus creative problems related to algebra, geometry, measurement, numbers, statistics, and probability. A Spanish...
Khan Academy
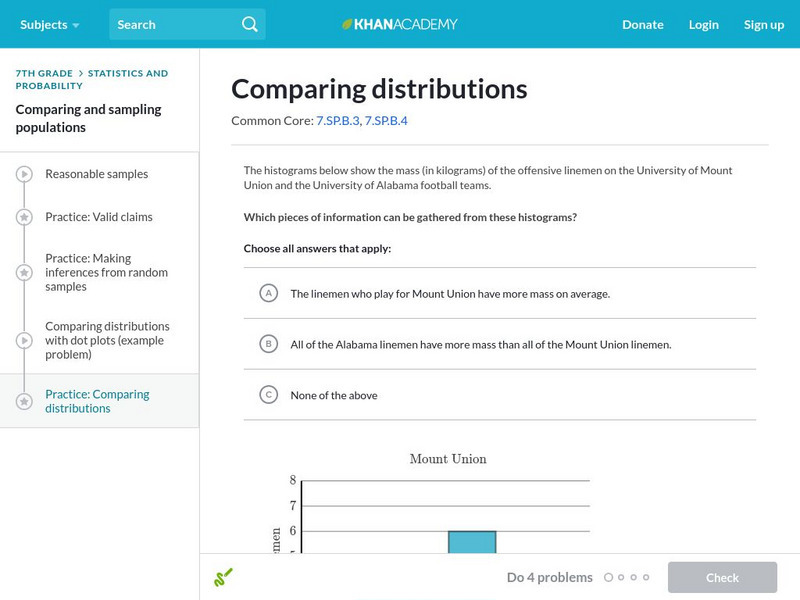
Khan Academy: Comparing Distributions
Practice comparing distributions of data in different forms of graphical representation.
Curated OER
Espn: Billie Jean King
Although she won numerous tennis championships, Billie Jean King will probably always be remembered for her victory against Bobby Riggs in the "Battle of the Sexes". Biographical facts and career statistics are included at this ESPN site.
National Council of Teachers of Mathematics
Nctm: Illuminations: Adjustable Spinner
An adjustable spinner to provide random spins of a computer based spinner for any mathematical experiment requiring random spins.


