Curated OER
The Two Coin Problem
In this math worksheet, students look for the answers to the 17 applications of looking at the outcomes of flipping two coins. They also graph the results.
Curated OER
Measures of Central Tendencies: Quartiles
In this statistics activity, students calculate the mean, median, mode, range, lower quartile, and upper quartile for 10 questions and interpret a box and whiskers graph.
Inside Mathematics
Suzi's Company
The mean might not always be the best representation of the average. The assessment task has individuals determine the measures of center for the salaries of a company. They determine which of the three would be the best representation...
Statistics Education Web
Double Stuffed?
True or false — Double Stuf Oreos always contain twice as much cream as regular Oreos. Scholars first measure the masses of the filling in regular Oreos and Double Stuf Oreos to generate a class set of data. They use hypothesis testing...
Statistics Education Web
Consuming Cola
Caffeine affects your heart rate — or does it? Learners study experimental design while conducting their own experiment. They collect heart rate data after drinking a caffeinated beverage, create a box plot, and draw conclusions. They...
Georgia Department of Education
Analytic Geometry Study Guide
Are you looking for a comprehensive review that addresses the Common Core standards for geometry? This is it! Instruction and practice problems built specifically for standards are included. The material includes geometry topics from...
EngageNY
Creating a Histogram
Display data over a larger interval. The fourth segment in a 22-part unit introduces histograms and plotting data within intervals to the class. Pupils create frequency tables with predefined intervals to build histograms. They describe...
Virginia Department of Education
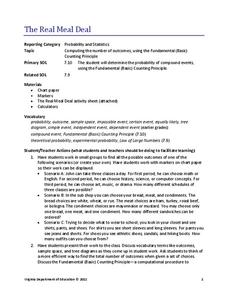
The Real Meal Deal
Burgers and salads and sodas, oh my! Scholars use a menu to investigate the Fundamental Counting Principle. They create tree diagrams to illustrate the number of possible choices for each given scenario.
Curated OER
The Mean, the Median, and the Mode
In this statistics and probability activity, students analyze data to determine the mean, median, or mode as indicated for the given set of data. The four page activity contains a combination of twenty-five multiple choice and free...
Scholastic
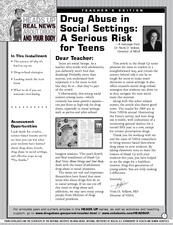
Drug Abuse in Social Settings: A Serious Task for Teens
Students discuss why drug abuse risk is higher in social settings. In this health science lesson, students interpret real life statistics on teen drug use. They describe refusal and prevention strategies.
Curated OER
Chart problems involving car defects and customer service departments
In this interactive worksheet, students solve two problems using the charts provided. Students must convey they are able to understand charts and how to read them.
EduGAINs
Data Management
Using a carousel activity, class members gain an understanding of the idea of inferences by using pictures then connecting them to mathematics. Groups discuss their individual problems prior to sharing them with the entire class. The...
Curated OER
Sampling
For this statistics and probability worksheet, students solve problems that involve various sampling methods and procedures. A calculator that generates random digits is required. The five page worksheet contains eight questions. ...
Curated OER
The Elvis Password Problem
In this statistics and probability worksheet, students determine how many eight-letter passwords can be made that contain the name ELVIS. The one page worksheet contains one problem. The solution is provided.
Curated OER
Analyzing Graphs
For this statistics and probability worksheet, students analyze frequency distribution tables or histograms and box and whisker plots. The two page worksheet contains four multiple choice questions. Answers are included.
Curated OER
Math Applications
In this math applications worksheet, students solve one word problem that has two parts to it. First, they determine the expected value of a ticket for a prize. Then, student determine the fair price for the ticket purchased and explain...
Curated OER
"M&Ms"® Candies Worksheet 1
In this math worksheet, students find the likelihood of different outcomes with the use of M and M's candy for the seven questions and fill in the graphic organizer.
Curated OER
Possible Outcomes 6
In this math worksheet, 6th graders make predictions of the possible outcomes using the data taken from two word problems. The answers are chosen from the outcomes that are possible using the multiple choice format.
Curated OER
Mean, Standarad Deviations, and Variances
For this Statistics worksheet, 11th graders compute the mean, standard deviation and variances for four different problem scenarios. The one page worksheet contains four scenarios, each with eight questions. Answers are provided.
Curated OER
Statistical Analysis
In this statistics worksheet, students analyze the data provided in order to determine the null hypothesis, an alternate hypothesis, and the significant difference between the groups. The one page worksheet contains three scenarios with...
Curated OER
Graphing Activity
In this probability and statistics worksheet, students work with a family member to construct graphs based on real life data. The two page worksheet contains three questions. Answers are not included.
Curated OER
Working with Frequency Tables
In this Working with Frequency Tables worksheet, students analyze data that is organized in simple frequency charts. They calculate average from data presented in a frequency table, calculate a cumulative score, and identify data that...
Curated OER
Two-factor ANOVA
In this statistics and probability learning exercise, students analyze the variance (ANOVA) to determine if two or more samples have the same "mean" or average. The one page learning exercise contains three problems. Answers are provided.
Curated OER
Pwerball Problem
In this statistics and probability activity, students consider the problem of lowering the odds of the Powerball lottery by determining the range of the white balls and the powerball. The one page activity contains one problem with...


