Curated OER
Probability
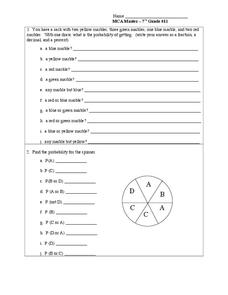
Seventh graders solve and complete 2 different problems that include a number of other possibilities. First, they draw a marble as stated for each out of a sack of marbles and determine the probability of getting that particular marble....
Virginia Department of Education
Normal Distributions
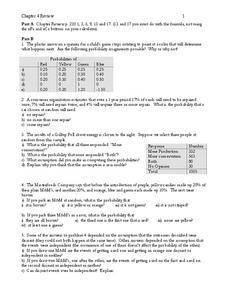
Pupils work to find probabilities by using areas under the normal curve. Groups work to calculate z-scores and solve real-world problems using the empirical rule or tables.
Curated OER
Most Likely/Least Likely
Learners consider a practice problem which prompts them to choose the type of marble most likely to be picked out of a group. Then, they answer probability-type questions regarding a spinner, and a tally chart of coins.
Curated OER
Probability
In this probability worksheet, students solve and complete 16 various types of problems related to statistics. First, they determine the probability of the statistics that are true as shown. Then, students find the conditional...
Curated OER
Football Statistics
In this math worksheet, learners examine the statistical information as provided in the graphic organizer and calculate the other values.
Curated OER
Food Probability
For this math worksheet, middle schoolers plot the possibilities of outcomes for making sandwiches and ice cream in the graphic organizers.
Curated OER
How Much Do I Watch TV?
In this television watching worksheet, students determine the amount of television they watch in a week by recording the names and times of the shows. They total the number of hours of watching time. You can use this with upper...
Curated OER
Possible Outcomes
In this statistics worksheet, students plot the possible statistical outcomes by examining the data and plotting the missing answer for the four problems.
Curated OER
Mode Mean Median
In this statistics worksheet, students practice finding number averages and statistics by finding the mode, median, and mean for the number sets.
Curated OER
"M&M's"® Candies Worksheet 2
In this math worksheet, students plot the mean, median, and mode for the colors of M and M candies by filling in the graphic organizer.
Curated OER
The Two Coin Problem
In this math instructional activity, students look for the answers to the 17 applications of looking at the outcomes of flipping two coins. They also graph the results.
Curated OER
"M&Ms"® Candies Worksheet 1
In this math worksheet, students find the likelihood of different outcomes with the use of M and M's candy for the seven questions and fill in the graphic organizer.
Curated OER
Chapter 11 What's Your Preference
In this math worksheet, students record the results of a survey taken from family members about relationships and activities.
Curated OER
Modern Physics, New Phenomena
For this physics worksheet, students examine some of the historical theories of physics through the completion of 11 questions.
Curated OER
Mean, Mode and Bar Graphs
In this mean, mode and bar graphs worksheet, 5th graders analyze the data given, then answer three questions about a bar graph and the data shown.


