Hi, what do you want to do?
E-learning for Kids
E Learning for Kids: Math: Dinosaurs: Data and Chance
Students can play learning games to explore how to label, read, and create graphs using a dinosaur theme.
E-learning for Kids
E Learning for Kids: Math: Music / Dance Performance: Data and Chance Experiments
On this interactive site students use the setting of a dance performance to predict all possible outcomes and make vertical and horizontal bar graphs.
CK-12 Foundation
Ck 12: Algebra: Fitting Lines to Data
[Free Registration/Login may be required to access all resource tools.] Make a scatter plot of data and find the line of best fit to represent that data.
E-learning for Kids
E Learning for Kids: Math: Music, Dance Performance: Chance & Data
Nadir and his family play in a band. Can you help him get all the instruments together? In these activities, students will write data using symbols, use one object to represent one item, create a column graph, and determine whether...
PBS
Pbs Lesson Plan: Chances Are Talking Probability (Pdf) [Pdf]
An introductory lesson in probability for students in grades three to five. The concepts presented in this lesson are interwoven, over time, into a current unit of study. Students examine closely the "language" of probability as used in...
Education Development Center
Math Partners: Statistics and Probability [Pdf]
Comprehensive unit that consists of lessons and activities designed to help students learn statistics and probability concepts.
Wolfram Research
Wolfram Math World: World's Most Extensive Mathematics Resource
MathWorld provides a huge mathematics encyclopedia detailing the concepts of geometry, algebra, calculus, discrete math, number theory, and other math topics--complete with formulas, diagrams, examples, and references for thorough...
ClassFlow
Class Flow: Probability Spinner Handling Data
[Free Registration/Login Required] Students construct a probability spinner and then test, graph and analyze their data.
Texas Instruments
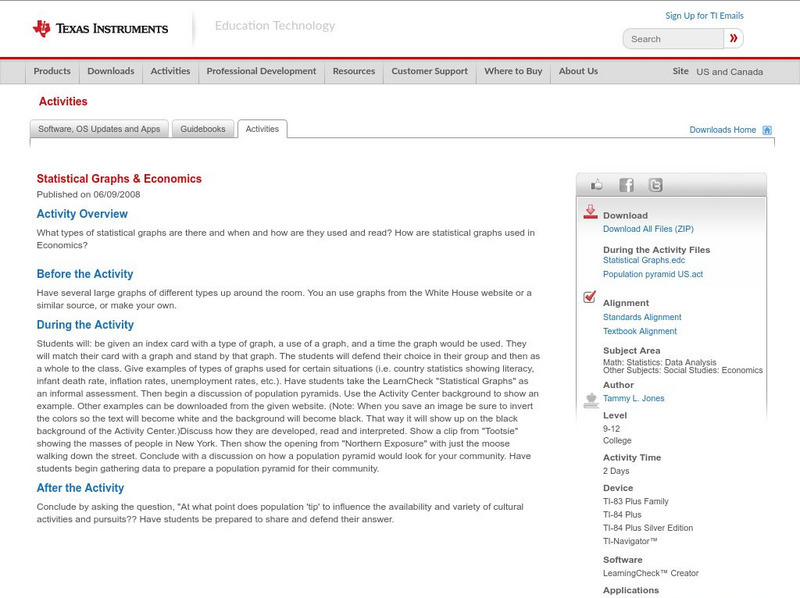
Texas Instruments: Statistical Graphs & Economics
What types of statistical graphs are there and when and how are they used and read? How are statistical graphs used in Economics?
Khan Academy
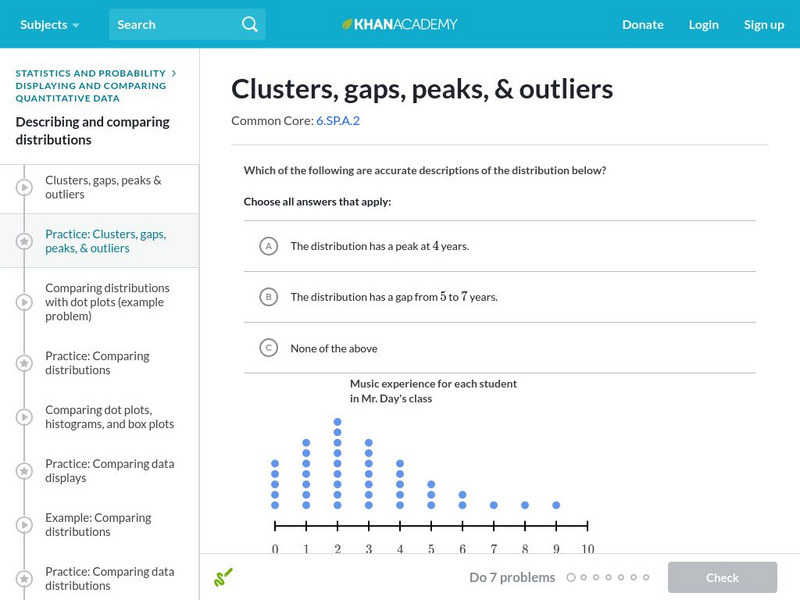
Khan Academy: Clusters, Gaps, Peaks, and Outliers
In this exercise, students practice describing data distributions as clusters, gaps, peaks, and outliers. Students receive immediate feedback and have the opportunity to get hints and try questions repeatedly.
CK-12 Foundation
Ck 12: Statistics: Interpretation of Circle Graphs Grade 7
[Free Registration/Login may be required to access all resource tools.] Interpret circle graphs by using given data.
Texas Instruments
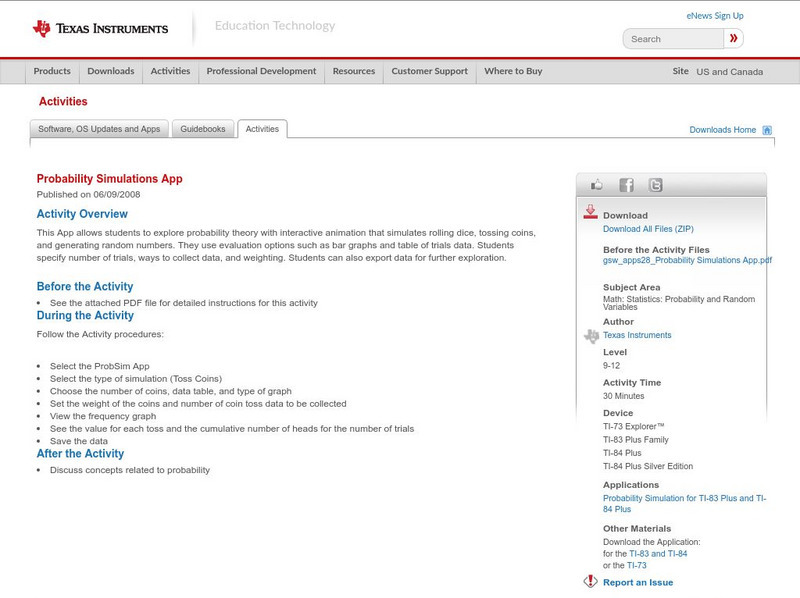
Texas Instruments: Probability Simulations App
This App allows students to explore probability theory with interactive animation that simulates rolling dice, tossing coins, and generating random numbers. They use evaluation options such as bar graphs and table of trials data....
Oswego City School District
Regents Exam Prep Center: Statistical Studies, Central Tendency, and Dispersion
The mathematics tutorial investigates statistical studies, central tendency, and dispersion. The lesson consists of class notes, calculator tips, examples, and practice problems with solutions. The teacher resource includes an activity...
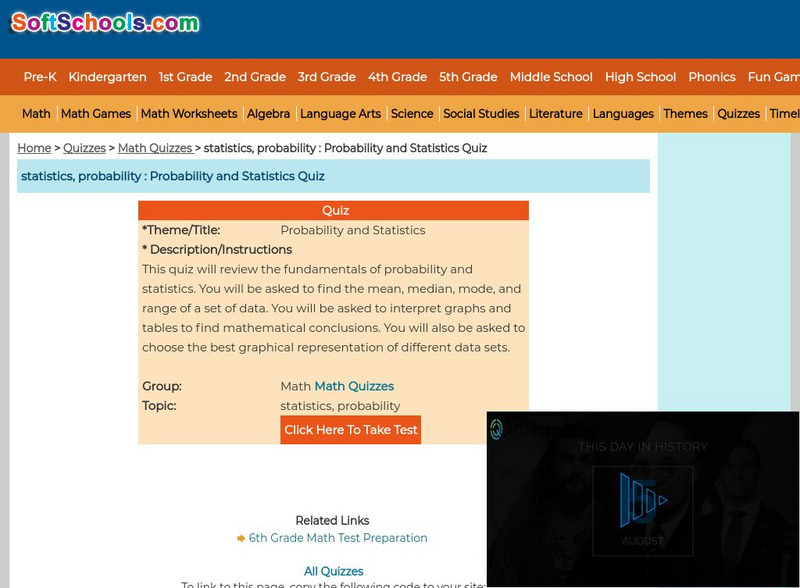
Soft Schools
Soft Schools: Probability and Statistics Quiz
Students are asked to find the mean, median, mode, and range of a data set. Also, they must be able to interpret graphs and tables, and graphically represent data. The quiz is multiple choice and consists of nine questions, and a summary...
Khan Academy
Khan Academy: Interpreting Quartiles
Practice understanding the meaning of quartiles of data sets. Students receive immediate feedback and have the opportunity to try questions repeatedly, watch a video or receive hints.
Khan Academy
Khan Academy: Creating Dot Plots
Practice creating dot plots. Dot plots are very similar to frequency tables, but they make it easier to see the data. Students receive immediate feedback and have the opportunity to try questions repeatedly, watch a video or receive hints.
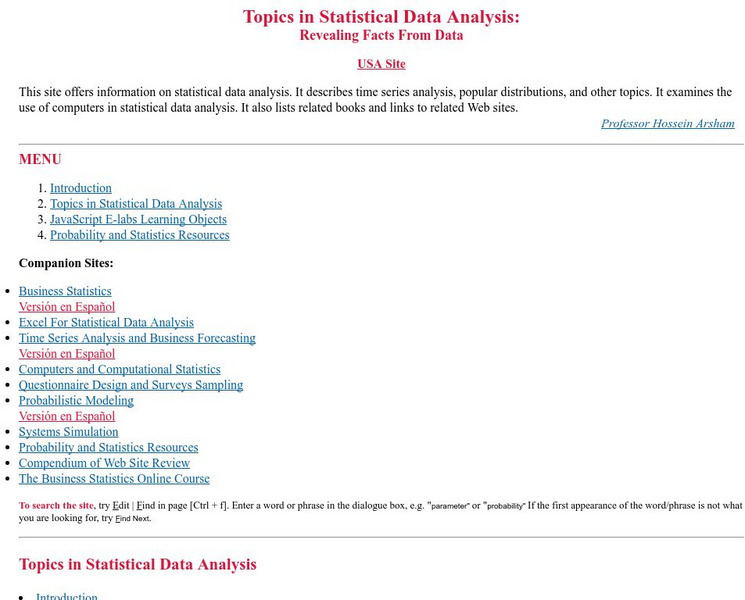
University of Baltimore
University of Baltimore: Short History of Probability & Statistics
Several brief paragraphs give a short account of the history of the study of probability and statistics. Also included are many additional resources for referencing. Written by Dr. Hossein Arsham
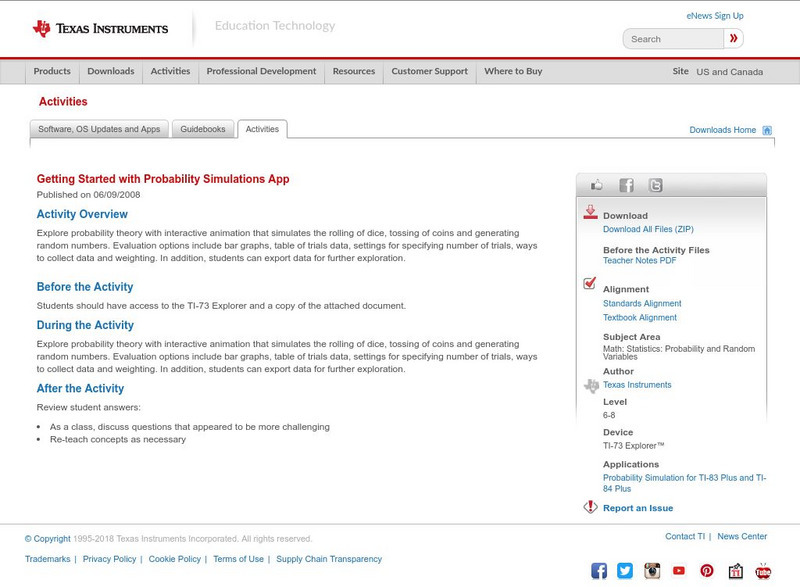
Texas Instruments
Texas Instruments: Getting Started With Probability Simulations App
Explore probability theory with interactive animation that simulates the rolling of dice, tossing of coins and generating random numbers. Evaluation options include bar graphs, table of trials data, settings for specifying the number of...
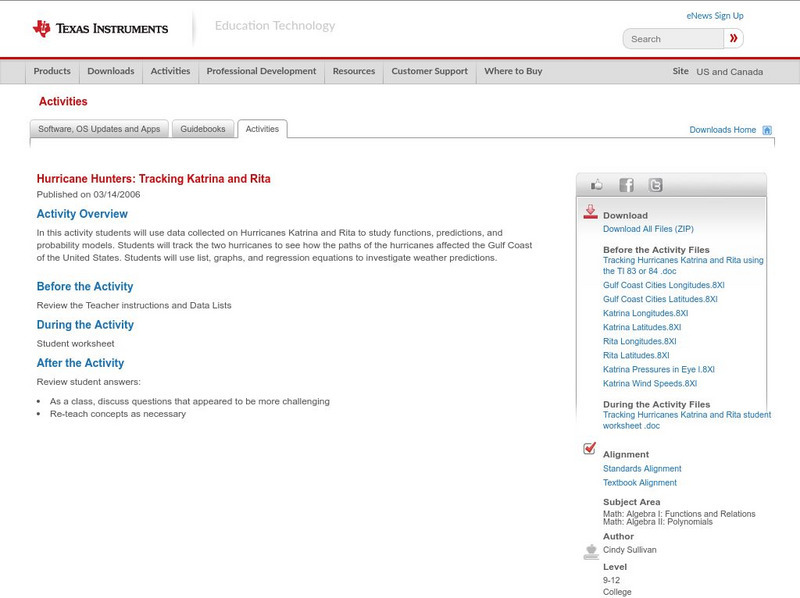
Texas Instruments
Texas Instruments: Hurricane Hunters: Tracking Katrina and Rita
In this activity students can use data collected on Hurricanes Katrina and Rita to study functions, predictions, and probability models. Students will track the two hurricanes to see how the paths of the hurricanes affected the Gulf...
Other
Stat Soft: Statistics Glossary
Dozens of statistical terms are defined and illustrated in this glossary.
Microsoft
Microsoft Education Lesson Plan: Candy Is Dandy
Explore color distribution of M&M candies using this detailed lesson plan. An engaging integrated instructional activity that requires understanding of spreadsheets and formulas, and logical reasoning. Links to related websites.
ClassFlow
Class Flow: Dice and Probability
[Free Registration/Login Required] This flipchart is designed to explore the probability of rolling certain values using the dice tool. By the end of this lesson, the students will have gathered experimental data, made hypothesis about...
Teachnology
Teachnology: Teacher Guide to Probability and Statistics
Statistics Theme provides a collection of free sample worksheets, teacher resources, lesson plans and interactive media for grades k-12.
Other
Statistics Education Web: Bubble Trouble [Pdf]
Use random sampling to formulate, collect, and compare data from two populations. Written by Peter Banwarth of Oregon State University.






![Pbs Lesson Plan: Chances Are Talking Probability (Pdf) [Pdf] Unknown Type Pbs Lesson Plan: Chances Are Talking Probability (Pdf) [Pdf] Unknown Type](https://static.lp.lexp.cloud/images/attachment_defaults/resource/large/FPO-knovation.png)







![Statistics Education Web: Bubble Trouble [Pdf] Lesson Plan Statistics Education Web: Bubble Trouble [Pdf] Lesson Plan](https://content.lessonplanet.com/knovation/original/715465-988c4be74f96df36c2d9bcb6f2f5182f.jpg?1661829195)