Cuemath
Cuemath: Frequency Distribution Table
A comprehensive guide for learning all about frequency distribution tables with definitions, how to create a frequency distribution table, and the formulas and graphs related to frequency distributions. With solved examples and...
Other
Bscs: Budburst Lilac Festival
In this self-directed activity, students use graphs and maps of lilac phenology data to determine the best time to host a lilac blossom festival in their area. A handout with everything the student needs to complete this lesson is...
Khan Academy
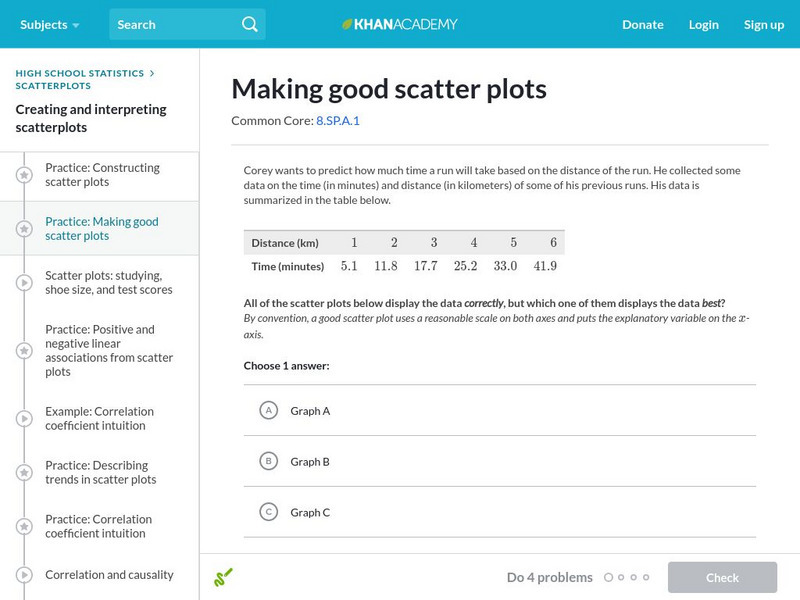
Khan Academy: Making Good Scatter Plots
A good scatter plot has the independent variable on the x-axis and the dependent variable on the y-axis. Also, the scale of both axes should be reasonable, making the data as easy to read as possible. In these practice problems, we...

