Hi, what do you want to do?
ClassFlow
Class Flow: Dice and Probability
[Free Registration/Login Required] This flipchart is designed to explore the probability of rolling certain values using the dice tool. By the end of this lesson, the students will have gathered experimental data, made hypothesis about...
Teachnology
Teachnology: Teacher Guide to Probability and Statistics
Statistics Theme provides a collection of free sample worksheets, teacher resources, lesson plans and interactive media for grades k-12.
Khan Academy
Khan Academy: Dot Plots and Frequency Tables Review
Dot plots and frequency tables are tools for displaying data in a more organized fashion. In this article, we review how to make dot plots and frequency tables.
Alabama Learning Exchange
Alex: My Peanut Butter Is Better Than Yours!
The students will engage in the process of statistical data comparing data using tables and scatterplots. The students will compare data using measures of center (mean and median) and measures of spread (range). This instructional...
Other
Statistics Education Web: Bubble Trouble [Pdf]
Use random sampling to formulate, collect, and compare data from two populations. Written by Peter Banwarth of Oregon State University.
Other
Ohio Department of Education: Fifth Grade Achievement Test (Practice Test) [Pdf]
Half-length practice test for the third grade OAT (Ohio Achievement Test). The test includes 17 multiple-choice and 3 open-response question dealing with topics such as measurement (unit conversion, time), geometry (volume, area), data...
Khan Academy
Khan Academy: Create Histograms
Practice creating histograms. Students receive immediate feedback and have the opportunity to try questions repeatedly, watch a video or receive hints.
Other
Laus Dnet: Grade 5 Excel Lesson Plan
In this online lesson plan, students will survey students in their school to determine their favorite type of hand-held ice cream. Before performing the survey, students will make predictions about which ice creams they think will be the...
Math Is Fun
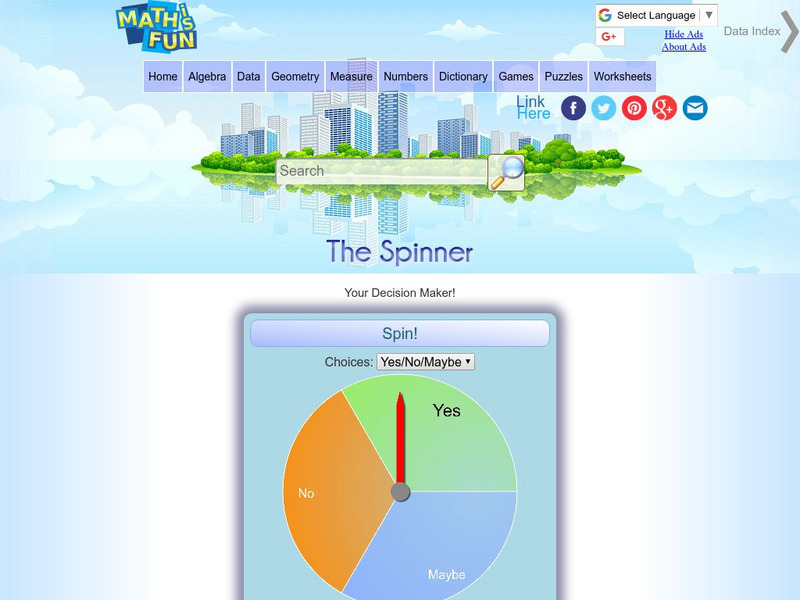
Math Is Fun: The Spinner: Your Decision Maker
This handy math spinner does most of the work for you. You can choose whether to use numbers, dice, yes/no, etc., and how many sections there are on the spinner. Then you spin it and it tabulates the results, creating a bar graph as it...
Khan Academy
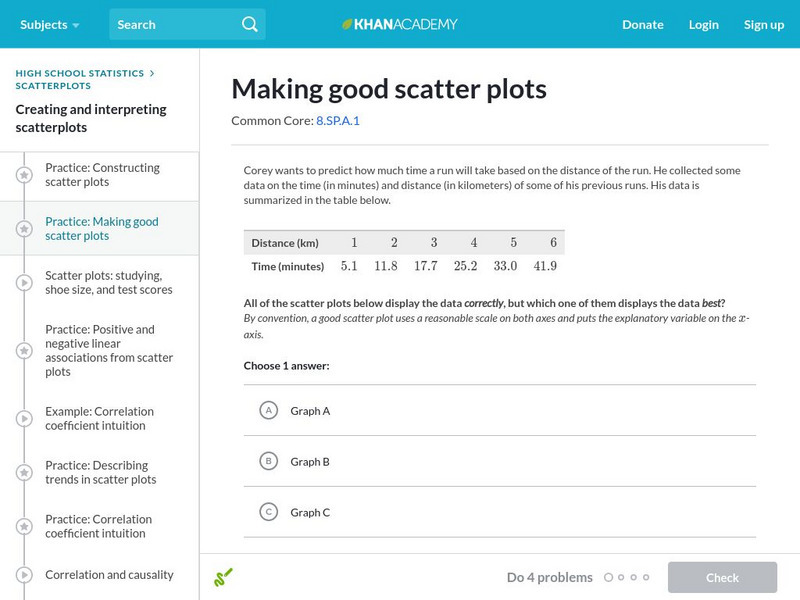
Khan Academy: Making Good Scatter Plots
A good scatter plot has the independent variable on the x-axis and the dependent variable on the y-axis. Also, the scale of both axes should be reasonable, making the data as easy to read as possible. In these practice problems, we...
US Department of Education
National Center for Education Statistics: Nces Classroom
Just what is the NCES Students' Classroom? In addition to many useful features, this site provides math and statistical activities tailored to a middle and elementary school students.
Richland Community College
Richland Community College: Math 116 Lecture Notes
This site from the Richland Community College provides the detailed lecture notes to a college algebra course, complete with equations and definitions. Content ranges from "functions and their graphs" to "conics and parametric equations."
Other
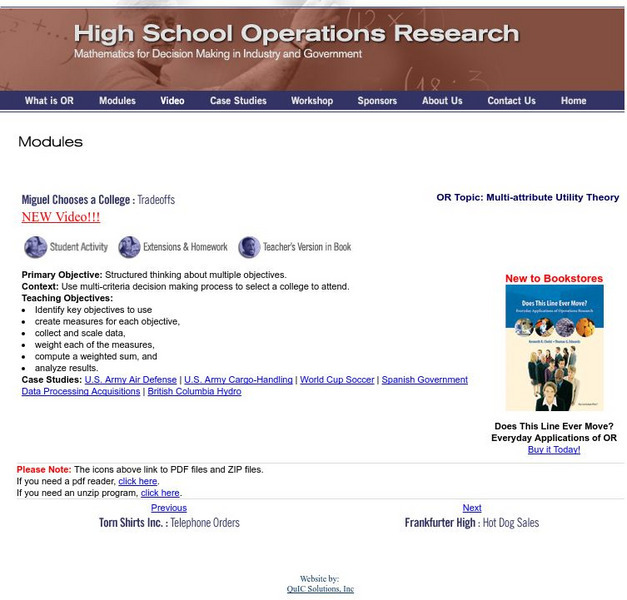
Hsor.org: Miguel Chooses a College: Tradeoffs
Use several strategies and criteria to help Miguel determine the college for him.
Other
Ode: Seventh Grade Achievement Test (Practice Test) [Pdf]
Half-length practice test for the third grade OAT (Ohio Achievement Test). The test includes 17 multiple-choice and 4 open-response questions dealing with topics such as number sense (order of operations, ratios), measurement (metric...
Texas Instruments
Texas Instruments: The Normal Distribution
Students graph normal distributions, shade desired areas, and find related probabilities. They graph Normal probability scatter plots to check the normal (linear) shape of a data distribution.
Texas Instruments
Texas Instruments: Numb3 Rs: Galton Board
Based off of the hit television show NUMB3RS, this lesson has students find the probability of chips falling into each bin of a Galton Board (also known as a quincunx or Plinko board), and then graphing these data to form a normal curve....
Web Elements
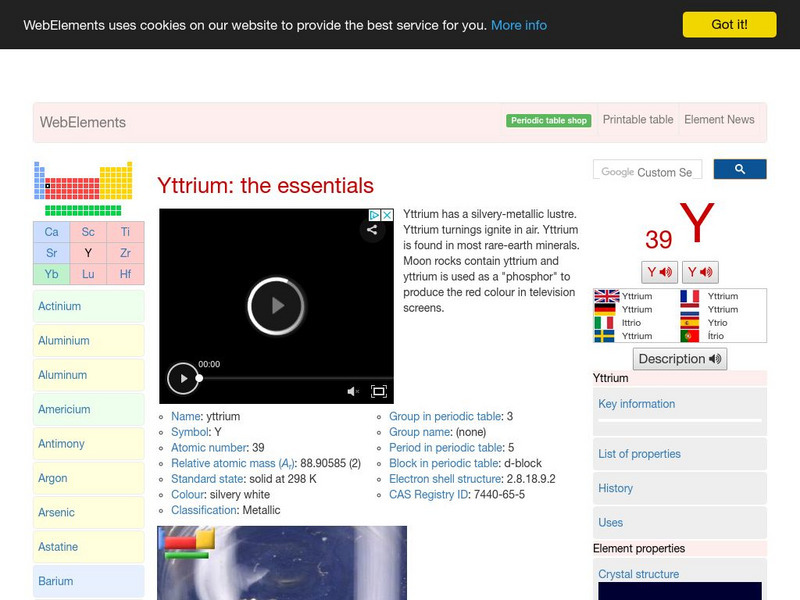
Web Elements Periodic Table: Yttrium
At this site from Mark Winter at WebElement, you can navigate around for charts and graphs of data on Yttrium. Probably the most comprehensive of all periodic tables on the web.




![Statistics Education Web: Bubble Trouble [Pdf] Lesson Plan Statistics Education Web: Bubble Trouble [Pdf] Lesson Plan](https://content.lessonplanet.com/knovation/original/715465-988c4be74f96df36c2d9bcb6f2f5182f.jpg?1661829195)
![Ohio Department of Education: Fifth Grade Achievement Test (Practice Test) [Pdf] Study Guide Ohio Department of Education: Fifth Grade Achievement Test (Practice Test) [Pdf] Study Guide](https://static.lp.lexp.cloud/images/attachment_defaults/resource/large/FPO-knovation.png)


