Hi, what do you want to do?
Mangahigh
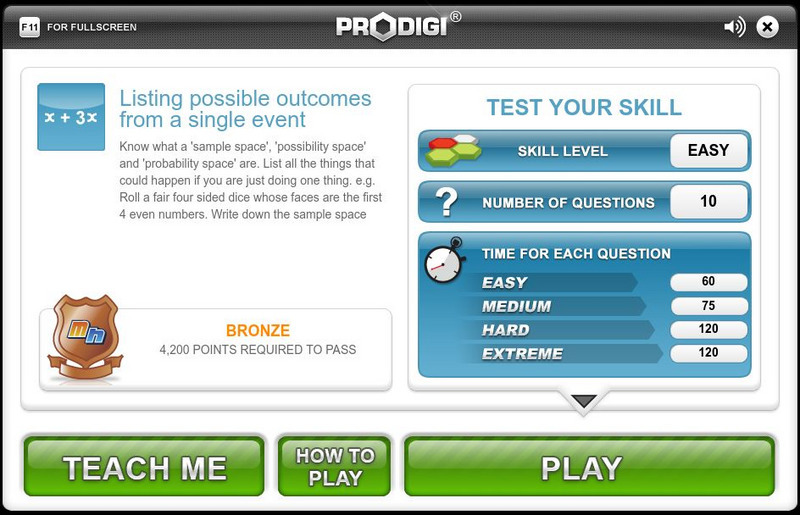
Mangahigh: Data: Listing Possible Outcomes From a Single Event
Students learn about the concept of outcomes by exploring a tutorial. They can then test their knowledge by taking a ten question assessment that increases in difficulty as they correctly answer questions.
Mangahigh
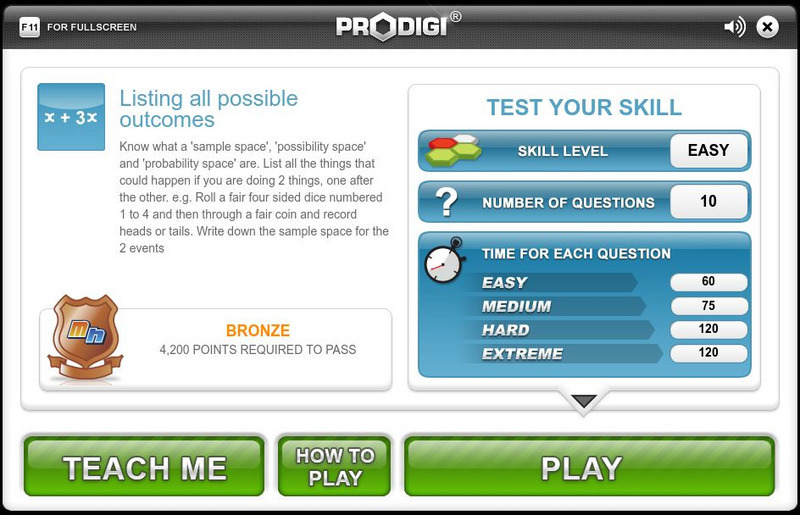
Mangahigh: Data: Listing All Possible Outcomes
Students learn about the concept of possible outcomes by exploring a tutorial. They can then test their knowledge by taking a ten question assessment that increases in difficulty as they correctly answer questions.
Oswego City School District
Regents Exam Prep Center: Tree Diagrams
This tutorial demonstrates how tree diagrams are constructed and shows how to calculate the probability of an event using a tree diagram. There are links to a lesson, practice page, and teacher resource pages with useful tips.
Other
Bowling Green St Univ: Listing the Sample Space
This site from Bowling Green State University defines all possible outcomes (the sample space). Understanding the possible outcomes makes assigning probabilities to different outcomes easier. Several quick examples are provided for the...
ClassFlow
Class Flow: Donkey Derby Handling Data
[Free Registration/Login Required] Can you list all probabilities when two dice are thrown? Run your own race here and see which donkey wins.
Rice University
Rice University: The Hand Squeeze
Students will enjoy this data collection and class analysis experiment involving the time it takes for a hand squeeze to travel around a circle of people. From organizing the activity to collecting the data to making a table and graphing...


