Curated OER
Cyber Chow Combos
Using a worksheet that's embedded in the plan, elementary schoolers must come up with the most possible combinations of food they can order from the menu on the worksheet. The activity is meant to be done independently by everyone, then...
Curated OER
Using Arrays to Show Multiplication Concepts
Learners practice multiplication concepts. In this multiplication lesson, pupils make arrays by using counters and solve various multiplication questions. They model arrays with counters for reinforcement.
Curated OER
Transformations and Matrices
There are four activities in this extensive instructional activity covering the identity matrix and scaling, the linear representation of translations, the linear representation of rotations, and reflections. In small groups, they use...
Curated OER
Seed Swapping
Here is a fabulous, cross-curicular lesson on seeds. Elements of science, writing, math, agricultural practices, and art are all brought into this incredibly thorough plan. Additionally, a fun whole-class game is presented, and there is...
Ohio Department of Education
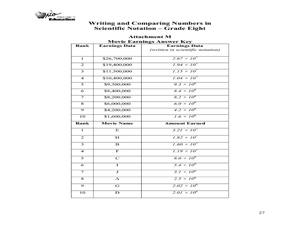
Writing and Comparing Numbers in Scientific Notation-Grade Eight
Explore scientific notation in this mathematics lesson. Young mathematicians explore multiple representations of large number in scientific notation through the use of models, visual representation and expanded form. The lesson provided...
Curated OER
Indy 500
Start your engines! Small groups collect data from websites pertaining to the Indianapolis 500 in order to determine average speed per lap and miles in each lap. The lesson requires prior knowledge of the the formula d=rt.
Shodor Education Foundation
Algorithm Discovery with Venn Diagrams
Here is a lesson that takes an interesting approach to analyzing data using box and whisker plots. By using an applet that dynamically generates Venn diagrams, the class forms a strategy/algorithm for guessing the rule that fits...
Curated OER
Addition and Subtraction of Fractions
Learners demonstrate how to solve addition and subtraction of fractions. In this fractions lesson, students use folded paper to shade in fractional parts and identify the sum of the parts shaded.
Charleston School District
Constructing Reflections
An informative video and handout provide the basic information needed to reflect any pre-image across either of the axes on the coordinate plane. The printed resource provides a preview of reflecting across lines other than an axis....
Curated OER
Data Analysis and Probability
Students design models to simulate actual events using various random devices. They estimate the likelihood of a particular outcome using results of simulation. In addition, they simulate the births of three children to a using a coin.
Curated OER
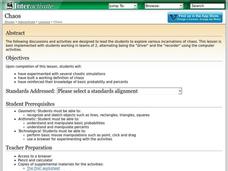
Chaos
Learners explore the concept of probability. In this probability lesson, students use a applet that demonstrates chaos and probability of spread for a forest fire. Learners also play applets about the Game of Life and Rabbits and Wolves,...
Curated OER
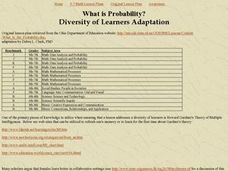
What is Probability?
Students participate in a variety of activities in order to understand the concept of probability. The students are engaged because of the application of The Multiple Intelligences Theory.
Curated OER
What is Probability?
Students use an abacus as well as a calculator for calculations to bring multicultural awareness and appreciation to this lesson. They discuss the history of the abacus. Students compare/contrast the abacus to the computer.
Curated OER
Measures of Central Tendency Using Scientific Calculators
Learners explore mean, median, and mode as they model mathematics in real-world problem situations. The lesson requires the use of the TI 30X IIS.
Curated OER
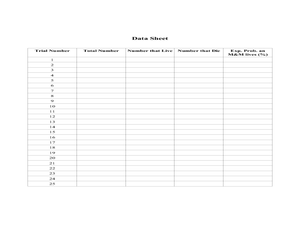
RIP M&M's
Students solve theoretical probability problems. In this algebra lesson, students apply the concept of probabilities to solving real life scenarios. They collect data and graph it using experimental probability.
Curated OER
Marble Grab Bag: Certainly? Maybe? Impossible?
Second graders use a hands-on activity and a data chart to explain the certainty, probability, or impossibility of drawing a particular color of marble from a bag. This lesson comes with an excellent website, and many good worksheets...
Curated OER
Shake It Up with Scatterplots
Learners identify how to use a scatterplot to compare two sets of data to determine if they are related. Then they identify and describe the definition of regression line (the "line of best fit"). Students also identify how scientists...
Curated OER
Drawing Bugs Game
Second graders explore probability by playing a drawing game with dice. After they roll a die, they draw a tree diagram to illustrate each of the possible outcomes.
Balanced Assessment
Legos
How many ways can you arrange two six-hole Legos? Scholars practice their understanding of combinations as they investigate this question. As they create a plan, they develop a specific definition of a combination.
Curated OER
Mean Meadian and Mode
Students apply central tendencies to given data. In this statistics lesson, students calculate the mean, median, and mode as it relates to their data. They collect data and graph it while identifying the way the numbers are ordered.
Curated OER
Snack Sack
First graders, after exploring agricultural products that can be considered snack foods, experience the concepts of ratio and probability. They analyze and record their class experience after dealing with the following snacks: peanut...
Curated OER
Solving a Legend- Exponents, Recursive and Explicit Equations.
Eighth graders play a game to solve problems. In this exponents and scientific notations lesson, 8th graders play a game in small groups to move colored disks from location A to location C. Students identify recursive patterns to solve...
Curated OER
Data and Scientific Graphs
Students conduct experiments and graph their data. In this statistics lesson, students collect data and graph it on a coordinate plane. They analyze the data looking for patterns and they discuss their findings with the class.
Curated OER
Buying and Selling Stocks
Students access prior knowledge of the stock market and how it works. In this buying and selling stocks instructional activity, students complete worksheets on stocks to understand how the stock market works. Students answer critical...


