Curated OER
ExplorA-Pond: 6th Grade Area and Random Number Tables
Sixth graders estimate surface area of a pond using a random number table.
Alabama Learning Exchange
Poppin' For Popcorn!
Students graph data from different popcorn flavors. In this graphing lesson, students make graphs using an assigned web site after collecting data about the flavors of popcorn that fellow classmates prefer.
Alabama Learning Exchange
Inch by Inch
Third graders listen to a read-aloud of Leo Lionni's, Inch by Inch before measuring a variety of items using both standard and metric units. They record the measurement data and follow a recipe for dirt pie.
Curated OER
Box-and-Whisker Plots
Eighth graders measure in feet and inches and convert to explore the relationship between the converted measurements. In this measurement lesson, 8th graders use the whisker and box plot to represent the measurement of a cat. Students...
Alabama Learning Exchange
Jelly Beans Add Up
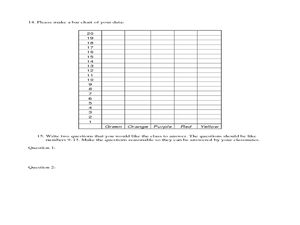
Students explore counting, sorting, and graphing skills. For this data analysis lesson, students sort jelly beans by color, count the jelly beans, and create a bar graph of the jelly beans according to color.
Curated OER
What Do We Do With A Dirty Bomb?
Students examine composition of dirty bomb and its possible effects on a city, and investigate simulations of such an event; students use computational and problem solving skills to assess damage and prepare report proposing solution to...
Center of Excellence for Science and Mathematics Education
A Sick Astronaut
Aspiring astronauts graph, interpret, and analyze data. They investigate the relationship between two variables in a problem situation. Using both graphic and symbolic representations they will grasp the concept of line of best fit to...
Curated OER
Star Cluster Math
In this star cluster math activity, students use four different patterns to solve five problems about the fraction of stars classified by their temperature.
Curated OER
Math is Everywhere!
For this everyday math skills pretest, students answer ten multiple choice questions based on their knowledge of everyday math skills such as estimation, addition, and measurement.
Curated OER
Real Misleading Graphs
Students identify real graphs and misleading graphs. In this algebra lesson, students surf the Internet for real life scenarios where graphs are used in a misleading way as well as in a correct way.
Curated OER
Using Ratios to Taste the Rainbow
Students solve problems using ratios and proportion. In this algebra lesson, students analyze skittles and their different colors as they apply the properties of ratios and proportions to solve their problems.
Curated OER
Football Statistics
In this math worksheet, learners examine the statistical information as provided in the graphic organizer and calculate the other values.
Alabama Learning Exchange
Meteor or Meteorite
Students differentiate between a meteor and meteorite. They participate in an experiment to discover how the size and weight of an object determines the size of the impact crater. They utilize their math skills by measuring with a ruler...
Curated OER
Tulip Graphing
Young scholars create a graph of tulip growth. In this data analysis lesson, students plant tulip bulbs and use graph paper to begin graphing data on the growth of the tulip.
Alabama Learning Exchange
What's Your Favorite Chocolate Bar?
Young scholars complete a math survey. In this math graphs lesson plan, students complete a survey about their favorite candy bars. Young scholars create different kinds of graphs using Microsoft Excel to show their results.
Curated OER
Where Did We Go on Holiday This Year?
In this differentiated whole-group activity worksheet, students list all the places they visited over the summer, record the places on a flip chart, calculate the distances on a road map and graph the data they collect.
Curated OER
Graphs Galore
Fourth graders conduct surveys to collect data. They analyze and interpret the data, then determine which type of graph is appropriate for the data. Students use the data to make predictions, discover patterns and draw conclusions...
Curated OER
Making Bar Graphs
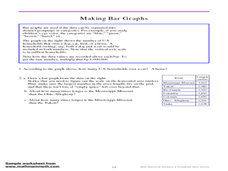
In this bar graph worksheet, learners answer short answer questions about bar graphs. Students answer 1 question about a bar graph about a cat, and 3 questions about a bar graph about U.S. rivers.
Curated OER
All About Ratios
Students investigate the use of multiplication and division of whole numbers to solve problems including equivalent ratios and rates.
Curated OER
A Data Processing Lesson for Statistics -- Reading a Table or Chart
Young scholars identify the structure and key parts of tables and charts. They determine which data is meanjngful and make comparisons with the data. They describe the scope of the AIDS plague throughout the world.
Curated OER
By The Pound
Students develop mathematical skills using measurement in the form of weight. They also perform calculations to find cost and strengthen estimation skills while comparing the actual price. The context for the lesson is in the industry of...
Curated OER
Understanding Weight
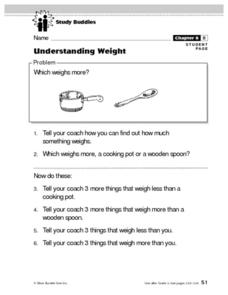
In this weight worksheet, students, with a partner, problem solve the answers to six word problems involving weight and everyday items found around the house and the classroom.
Curated OER
Using Linear Models
In this Algebra II instructional activity, 11th graders examine models whose behavior can be described by a linear function. The four page instructional activity contains explanation of topic, three guided problems, and eight practice...
Curated OER
Exact or Estimation
Students solve problems using estimation and exact calculations. In this algebra instructional activity, students use gum balls and thread to create hands on manipulatives to solve problems. They calculate the average of their total data.


