EngageNY
Estimating Probability Distributions Empirically 1
What if you don't have theoretical probabilities with which to create probability distributions? The 11th installment of a 21-part module has scholars collecting data through a survey. The results of the survey provide empirical data to...
EngageNY
Discrete Random Variables
You don't need to be discreet about using the resource on discrete variables. In the fifth installment of a 21-part module, scholars explore random variables and learn to distinguish between discrete and continuous random variables. They...
EngageNY
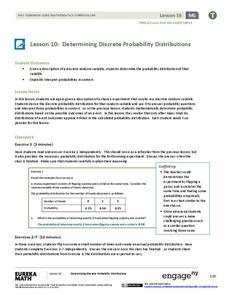
Determining Discrete Probability Distributions 1
Learn how to determine a probability distribution. In the ninth installment of a 21-part module, future mathematicians use theoretical probabilities to develop probability distributions for a random variable. They then use these...
Curated OER
Probability and Applications of Simulations
Middle schoolers apply properties of probability to the real world. In this probability instructional activity, learners simulate the construction of empirical distribution. They collect and analyze data using central tendencies.
EngageNY
Probability Distribution of a Discrete Random Variable
Learn how to analyze probability distributions. The sixth installment of a 21-part module teaches pupils to use probability distributions to determine the long-run behavior of a discrete random variable. They create graphs of probability...
EngageNY
Determining Discrete Probability Distributions 2
Investigate how long-run outcomes approach the calculated probability distribution. The 10th installment of a 21-part module continues work on probability distributions from the previous lesson. They pool class data to see how conducting...
EngageNY
Expected Value of a Discrete Random Variable
Discover how to calculate the expected value of a random variable. In the seventh installment of a 21-part module, young mathematicians develop the formula for expected value. They connect this concept the dot product of vectors.
EngageNY
Estimating Probability Distributions Empirically 2
Develop probability distributions from simulations. Young mathematicians use simulations to collect data. They use the data to draw graphs of probability distributions for the random variable in question.
Illustrative Mathematics
How Many Buttons?
Bring the class into the probability by having everyone count buttons on their shirts. Organize the data into the chart provided and chose different possibilities such as "female with one button" or "all learners with more than four...
Curated OER
Concept: Dependent Events
Middle and high schoolers determine the probability of dependent events. Students compute both compound and simple probability. This four-page worksheet contains six multi-step problems.
Google
The Law of Large Numbers and Probability
Learners investigate why theoretical probability doesn't always match reality. The activity involves using Python 2.7 (or Sage) to set up a Bernoulli Trial. It also involves setting up a spreadsheet to simulate the Birthday Paradox....
Curated OER
The Probability Project
Learners work together to complete a project on probability. In groups, they solve probability equations based on the formula and scenerio given to them in a PowerPoint presentation. To end the lesson, they take a quiz on each problem...
Curated OER
Probability - Week 6
In this probability worksheet, students solve complex probability problems containing logarithms, radicals, and square roots. This three-page worksheet contains nine problems.
Curated OER
Probability and Statistics
In this probability and statistics worksheet, high schoolers solve independent and dependent probability problems. They identify the mean, mode and range of a set of numbers. This two-page worksheet contains five probability problems.
Curated OER
Probability and Statistics - Week 10
In this probability and statistics worksheet, students find compound dependent and independent probability of given situations. They identify the mean, mode, range and median of sets. This two-page worksheet contains explanations,...
Curated OER
Probability: Basic Rules of Probability
In this probability worksheet, students determine the probability of independent and dependent events. They complete simple and compound events. This four-page worksheet contains five problems. Answers are provided.
Curated OER
4 Discrete Probability Distributions
Students read and complete problems on how to solve discrete probability distributions. In this probability distributions lesson plan, students read math problem examples and solve them.
Center of Excellence for Science and Mathematics Education
A Sick Astronaut
Aspiring astronauts graph, interpret, and analyze data. They investigate the relationship between two variables in a problem situation. Using both graphic and symbolic representations they will grasp the concept of line of best fit to...
Curated OER
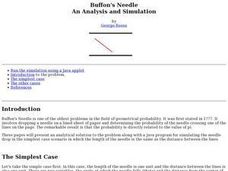
Buffon's Needle An Analysis and Simulation
If you dropped a needle on a lined sheet of paper what is the probability that the needle will cross one of the lines on the page? Surprise your class with how calculating this probability can approximate pi. This question is known as...
EngageNY
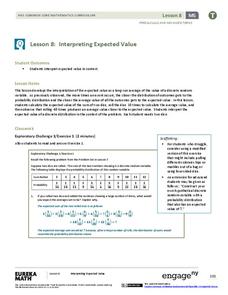
Interpreting Expected Value
Investigate expected value as a long-run average. The eighth installment of a 21-part module has scholars rolling pairs of dice to determine the average sum. They find aggregate data by working in groups and interpret expected value as...
Curated OER
Handling Data: Probability, Chase Me game
Students participate in a simulation in which the aim is for the tortoise to catch up with the hare or vice versa. Moves are decided by throwing two dice. Adding together the numbers on the two dice tells you which animal moves one...
Curated OER
Non-Random Variables: NBA Championship
Students demonstrate probability distribution of non-random variables. Students collect data on the NBA Championships. They record the data and compute subsets and permutations.
Curated OER
Linear Regression and Correlation
Learners explore scatter plots. In this linear regression lesson, groups of pupils graph scatter plots and then find the line of best fit. They identify outliers and explain the correlation. Each group summarizes and shares their...
Pennsylvania Department of Education
What is the Chance?
Fourth and fifth graders make predictions using data. In this analyzing data lesson, pupils use experimental data, frequency tables, and line plots to look for patterns in the data in order to determine chance. You will need to make a...


