Curated OER
Measurement
For this measurement worksheet, 7th graders solve 14 various types of problems that include completing a table with the base, height, and/or area of triangles and solving a number of word problems with measurement. They also estimate the...
Pennsylvania Department of Education
Multiplication Represented as Arrays
Third graders collect data about themselves and use in a line plot. In this analyzing data lesson plan, 3rd graders collect various sets of information,create a line plot and compare the data. Students complete a worksheet on their...
Curated OER
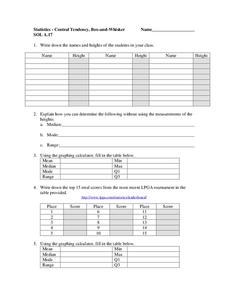
Central Tendency
In this central tendency worksheet, students solve and complete 10 different problems that include measures of central tendency. First, they write down the names and heights of students in their class. Then, students explain how they can...
Curated OER
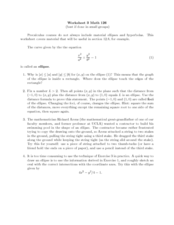
Worksheet 3 Math 126: Ellipses and Hyperbolas
In this ellipses and hyperbolas worksheet, students solve 8 short answer and graphing problems. Students graph ellipses, hyperbolas, and parabolas given an equation. Students identify the foci of an ellipse or hyperbola.
National Council of Teachers of Mathematics
Do I Have to Mow the Whole Thing?
In this mowing worksheet, learners find the area of given rectangles. They determine the combinations of lengths and widths that generate a given area. Learners graph given points. This two page worksheet contains sixteen multi-step...
Curated OER
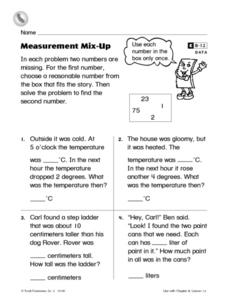
Measurement Mix-Up
In this measurement instructional activity, 2nd graders read 4 word problems and find the two numbers missing in each one. Students choose a reasonable number from the box that fits the story for the first number and then solve the...
Curated OER
Statistics
In this statistics worksheet, 9th graders solve and complete 10 various types of problems that include using different types of graphs to illustrate data. First, they determine the median score for each stem-and-leaf plot. Then, students...
Curated OER
Parabolas
For this algebra worksheet, students solve parabolas using the standard and vertex forms. They find the vertex and asymptote and graph the parabola. There are 64 problems.
Pennsylvania Department of Education
Freckle Face
Students collect and record data. In this early data analysis lesson plan, students gather data about their partners face. As a class, the students use tally marks and pictographs to record the data and answer question about the...
Curated OER
Data Management and Probability: Applications
In this data management and probability applications instructional activity, 7th graders solve 13 different types of problems that include finding the mean, median, mode, and range of each set of values, as well as, solving a number of...
Curated OER
Multiplying Matrices for Fun and Profit
Students explore matrix multiplication to generate new data. In this pre-algebra instructional activity, students solve problems by computing with matrices. Students explore the concept of matrices in the real-world context of running an...
Curated OER
Statistics
For this statistics worksheet, students solve and complete 6 different problems that include determining various types of statistics. First, they determine the data set where the median value is equal to the mean value. Then, students...
NASA
Benford's Law
In this Benford's Law learning exercise, high schoolers read about the first digit frequency of numbers. Students solve 3 problems about sunspot numbers, solar wind magnetism and the depth of the latest earthquakes by using on line sites...
Curated OER
Measures of Central Tendency
In this measures of central tendency worksheet, students solve and complete 6 different problems. First, they count the number of items in each set of data. Then, students determine the mean, median and mode for each. In addition, they...
Curated OER
Data Management and Probability: Applications
For this data management and probability applications worksheet, 8th graders solve 20 various types of probability problems. They find the mean, median, mode and range of various numbers. Then, students use the spinner illustration to...
Curated OER
Probability
In this probability worksheet, 8th graders solve and complete 15 different problems related to determining the probability of various events. First, they complete the table illustrated on the sheet. Then, students use the table to...
Curated OER
Stem-and-Leaf Plots
In this stem-and-leaf plots worksheet, 9th graders solve and complete 9 various types of problems. First, they determine the mean, median, and mode of the stem-and-leaf plot shown. Then, students summarize the similarities and...
Noyce Foundation
Truffles
Knowing how to scale a recipe is an important skill. Young mathematicians determine the amount of ingredients they need to make a certain number of truffles when given a recipe. They determine a relationship between ingredients given a...
California Education Partners
Miguel's Milkshakes
Moooove over, there's a better deal over there! The fourth segment in a series of eight requires individuals to determine the best unit cost for milk. Scholars calculate the least amount they can spend on a particular quantity of milk....
Curated OER
Exponential Functions
Analyze functions by their shape and equation and identify decay and growth based on the equation given. Learners graph their exponential functions and differentiate it using the logarithmic versus the exponential function.
Curated OER
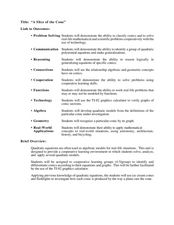
"A Slice of the Cone"
Here is a set of lessons that explore conics in a number of different ways. Starting with modeling how a conic is produced by the way a plane cuts the cone, to solving complex word problems, algebra learners progress through a series of...
Curated OER
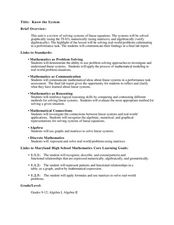
Know the System
Learners identify the different systems of equations. In this algebra lesson, students solve systems of equations using graphing, elimination and substitution. They use the Ti to graph their systems.
Curated OER
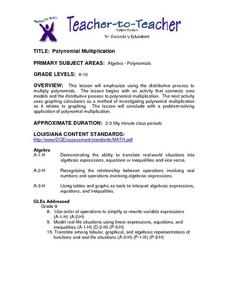
Polynomial Multiplication
Students review information about how to multiply polynomials and then work in pairs to complete a worksheet. They use graphing calculations to help them solve their math problems.
Curated OER
Systems of Linear Inequalities
In this Algebra I/Algebra II activity, students solve systems of linear inequalities by graphing the inequalities on a coordinate plane and determining the location of all ordered pairs that solve the system. The three page activity...


