Curated OER
TI-89 Activities for PreCalculus and AP Calculus
Using the TI-89 calculator, students explore the statistical, graphical and symbolic capabilities of the TI-89. Students investigate topics such as solving systems of equations, finding inverse functions, summations, parametrics...
Curated OER
TI-Nspire Activity: What Does Your Representation Tell You?
By learning to select the best representation for three meal plans, students compare three meal plans to determine the best choice. Data for the meal plans is sorted on a table, as an algebraic equation, and graphed on a coordinate grid....
Curated OER
Quadratics: Polynomial Form
Students determine how changes in the coefficients in a quadratic function affect its graph. They determine how to use the equation to determine the intercepts of a quadratic function. Students identify the location of the intercepts...
Curated OER
System of Two Quadratic Inequalities
Young scholars graph a quadratic inequality and describe its solution set. They solve a system of quadratic equalities graphically and symbolically and as related to a real-world context.
Curated OER
Quadratic Relation and Parabola
Students identify the vertex and intercepts of a parabola. In this algebra lesson, students graph parabolas and factor quadratic equations. They perform transformation on the parabolas.
Virginia Department of Education
Road Trip
Help plan a road trip with linear equations. Scholars consider two different rental car companies and write equations representing the cost for each company. They graph the system of equations to determine the conditions under which each...
Virginia Department of Education
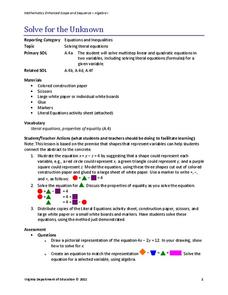
Solve for the Unknown
How can shapes help solve literal equations? Scholars first learn to replace variables with shapes to aid in solving literal equations. A worksheet of practice problems helps hone the skill.
Radford University
Curve of Best Fit
Don't watch the resource go down the drain. Scholars perform an experiment where they measure the amount of water that flows from a funnel over time. They use the data to create graphs and find the curves of best fit.
Curated OER
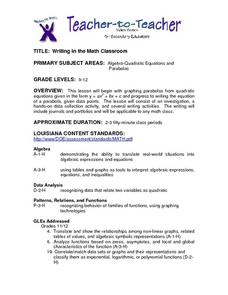
Writing in the Math Classroom
Students determine the vertex, y-intercept and direction of a parabola and write an explanation of how to graph a parabola. They collect and graph data using a calculator.
Curated OER
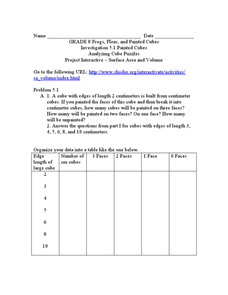
Analyzing Cubes
In this analyzing cubes worksheet, 9th graders solve and complete 6 different types of problems. First, they organize the given data into the table provided. Then, students study the patterns in the table and tell whether the pattern of...
Virginia Department of Education
Functions 2
Demonstrate linear and quadratic functions through contextual modeling. Young mathematicians explore both types of functions by analyzing their key features. They then relate these key features to the contextual relationship the function...
Yummy Math
Playing with my calculator on the 4th of July
This fun activity guides learners through an exploration of the effects of replacing f(x) with -f(x), f(x) + c, k f(x), and f(x + c). Using graphing calculators, students experiment with variations of the graph of y = x^2 to design a...
Mathematics Vision Project
Module 3: Numbers and Operations
Bring some concrete reasoning to the skills of multiplying and combining terms. Using various strategies, the six activities in the module provide practice for the skills of adding, subtracting, multiplying, and diving polynomials. The...
Curated OER
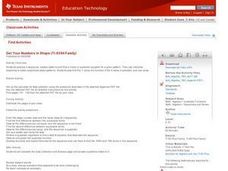
Get Your Numbers in Shape - TI-83
High Schoolers use the TI-83 calculator to produce a sequence, explore patterns and find a linear or quadratic equation for a given pattern. They use inductive reasoning to make conjectures about patterns. They find the Y-value of a...
Illustrative Mathematics
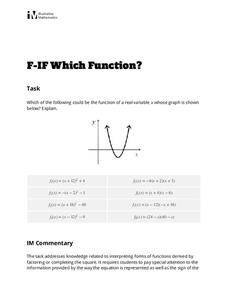
Which Function?
Learners are given a graph of a parabola on a coordinate system, but intercepts and vertex are not labeled. The task is to analyze eight given quadratic functions and determine which ones might possibly be represented by the graph. The...
Curated OER
Graphs and Transformations of Functions
Is it possible to solve quadratic equations by factoring? It is, and your class will graph quadratic equation and functions too. They perform transformation on their graphs showing increasing and decreasing intervals, domain, and range....
Curated OER
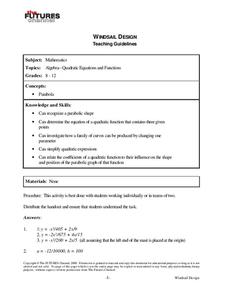
Windsail Design
Students fit quadratic models to windsail designs. In this fitting quadratic models to windsail designs lesson, students compare quadratic models of sails with different measurements and mast size. Students vary the a-value...
Curated OER
System of Two Quadratic Inequalities
Students set up and solve a system of quadratic inequalities related to real-world situations.
Curated OER
Find Minimum and Maximum
Learners engage in a lesson about finding the values of different graphs written in the vertex form. They rewrite each quadratic equation in vertex form while graphing the equation with the visual display of a parabola that matches the...
Curated OER
Completing the Square Algebraically
Using TI-Nspire, scholars rewrite quadratic expressions by completing the square. They change the equation into vertex form. By the end of this instructional activity, they should be able to change any quadratic equation into...
Curated OER
Discriminant Testing
The class works to identify solutions using the discriminant.They use part of the quadratic formula to find the number of solutions a quadratic equation will have. They calculate how-many times the quadratic function will cut the x-axis....
Curated OER
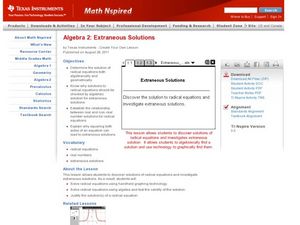
Extraneous Solutions
Learners find the roots of quadratic equations. In this algebra lesson, students solve radical equations and identify the positive and negative roots. They graph and analyze their functions.
5280 Math
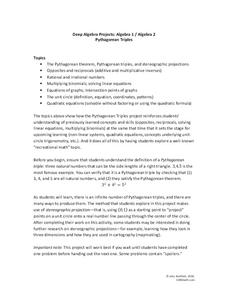
Pythagorean Triples
From Pythagorean triples to the unit circle. Learners use the Pythagorean Theorem to find Pythagorean triples and then relate their work to the unit circle in a fun algebra project. Their discovery that x^2+y^2 is always equal to one on...
Virginia Department of Education
Line of Best Fit
Pupils work through a guided activity on fitting a linear equation to a set of data by entering the data into a calculator and trying to envision a line of best fit. They then have the calculator determine the least-squares line and...


