Illustrative Mathematics
Modeling London's Population
Looking at London's population from 1801–1961 in 20 year increments, high school mathematicians determine if the data can be modeled by a given logistic growth equation. They explain their thinking and determine the values of each...
Curated OER
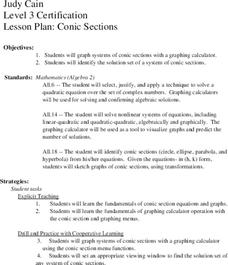
Conic Sections
Young scholars, while using a graphing calculator, graph systems of conic sections as well as identify their solutions. They complete various word problems dealing with conic sections with their calculators. In addition, students sketch...
Curated OER
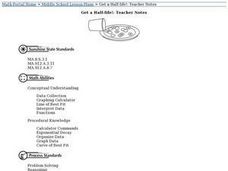
Get a Half Life!
Eighth graders use M&M's to experiment with data. They use a graphing calculator to determine the best equation for their data; linear, quadratic or exponential. They analyze the data to find the half-life of their M&M's.
Illustrative Mathematics
Springboard Dive
Dive into this problem that illustrates a real-world application of the quadratic formula. Learners are given an equation that represents the height of a diver above the water t seconds after leaving the springboard. The task is to...
Curated OER
Solving Absolute Value Inequalities
Start this activity with a brief description of how to solve absolute value inequalities. A space is provided to help classify the inequalities into types (greater than, less than, or equal to) and for learners to show how to graph their...
Inside Mathematics
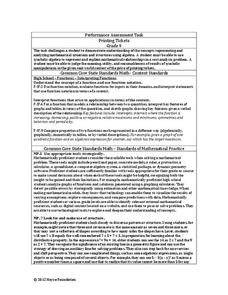
Printing Tickets
Determine the better deal. Pupils write the equation for the cost of printing tickets from different printers. They compare the costs graphically and algebraicaly to determine which printer has the best deal based upon the quantity of...
Curated OER
How Alike Are We?
Fourth graders find the range, mode, median, and mean for each of the data sets (height and shoe size). They discuss which measure of central tendency for each data set best represents the class and why. Students graph the shoe size and...
Curated OER
Maximize It!
Students design a rectangular box without a lid that has the largest possible volume using the supplied sheet of centimeter graph paper. They work in groups to construct different size boxes to determine the largest possible volume and...
Curated OER
Investigation - Looking For Triangles
Seventh graders investigate a series of triangles, looking for patterns and generalizing what they have found. They analyze the pattern data and organize it into a table and graph. Students identify the relationship and discover the rule...
Virginia Department of Education
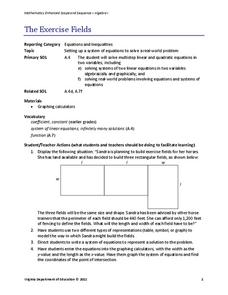
The Exercise Fields
Horses need exercise, too. Scholars create linear equations to model the perimeter of exercise fields for horses. They finish by solving their equations for the length and width of the fields.
Curated OER
Students Analyze Data With Scatter Plots
Scatter plot lessons can help students create different types of graphs by hand or with the aid of technology.
Inside Mathematics
Snakes
Get a line on the snakes. The assessment task requires the class to determine the species of unknown snakes based upon collected data. Individuals analyze two scatter plots and determine the most likely species for five additional data...
Mathematics Assessment Project
College and Career Readiness Mathematics Test C1
Challenge high schoolers with a thorough math resource. The 20-page test incorporates questions from upper-level high school math in applied and higher order questions.
Virginia Department of Education
Spring Fling Carnival
Think critically — and linearly by applying linear equations to solve real-world problems. Young mathematicians write equations to model the profit on popcorn and cotton candy at a carnival and solve problems using these equations.
Curated OER
Vertical and Horizontal Translations
Eleventh graders study seven functions. They use their handheld calculator to determine which family of functions the equation belongs, the parent function described, and they calculate the vertical and horizontal translation.
Curated OER
Parabola with Horizontal Directrix
Pupils find the vertex, directrix, and focus of a parabola. They graph parabolic functions and solve application problems involving parabalas.
Curated OER
Parabola With Horizontal Directrix
Students find the vertex, directrix, and focus of a parabola and graph parabolic functions. They solve problems involving parabolas after a demonstration lesson by the teacher.
Curated OER
Calculator-Based Lessons Help Examine Real-World Data
Students may determine equations based on graphs and regression models.
Curated OER
Extraneous Solutions
Students find the roots of quadratic equations. In this algebra lesson, students solve radical equations and identify the positive and negative roots. They graph and analyze their functions.
Curated OER
Mathematical Relationships
Students practice graphing a linear equation and a parabolic equation. They work cooperatively to select numbers, including fractions, which they will put into ordered pairs. Students explain their process to the class, discussing what...
Curated OER
Pyrotechnics
Students discuss pyrotechnics and what they have noticed about their height and speed. They think about the path which fireworks follow which is a parabola. They follow multiplication patterns to determine the Zero Product Property and...
Ms. Amber Nakamura's Mathematics Website
Algebra Project
What would your dream house look like? A cottage? A medieval castle? High schoolers enrolled in Algebra design the perfect house while using slopes to write equations for various aspects of the project.
Curated OER
Crossing the Asymptote
Students investigate graphs and their asymptotes. In this precalculus lesson, students examine the numerator and denominator of their rational functions. This helps them identify where and when the graph will cross its asymptote.
Curated OER
Will Exams Be Cancelled?
If the flu outbreak continues, exams will have to be canceled. Investigate the properties of exponential and logarithmic functions. For this algebra lesson, students use the TI to examine and differentiate between exponential growth and...


