Made by Educators
Sociological Methods
First year undergraduate sociology students can prepare for their exams with an application that provides practice questions in six categories: Quantitative and Qualitative Data, Sources of Data, Primary and Secondary Data, Positivism...
Curated OER
Photosynthesis
Students recognize the importance of plants as they perform an experiment involving photosynthesis. Students determine the optimum wavelength of light for photosynthesis by exposing plants to different colors of light, collecting data,...
Curated OER
Leonardo da Vinci
Students select appropriate tools and technology to perform tests, collect data, and display data. They construct appropriate graphs from data and develop qualitative statements about the relationships between variables.
Curated OER
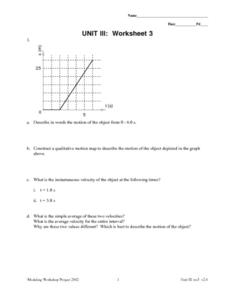
Unit III: Worksheet 3 - Uniform Acceleration
This three-page worksheet moves physics masters to show what they know about motion. They analyze graphs of time versus displacement, solve instantaneous and average velocities, solve word problems, and graph results. This is an...
Curated OER
Unit III: Worksheet 1 - Uniform Acceleration
This concise handout posts a diagram of a block sliding down a ramp. High schoolers draw qualitative graphical representations for displacement vs. time, velocity vs. time, and acceleration vs. time. They draw a motion map and list the...
Illustrative Mathematics
Velocity vs. Distance
At the end of this activity, your number crunchers will have a better understanding as to how to describe graphs of velocity versus time and distance versus time. It is easy for learners to misinterpret graphs of velocity, so have them...
Curated OER
What's in the Water? - Stream Side Science
Here is a complete activity in which young biologists or ecologists test the pH, dissolved oxygen, turbidity and temperature of stream water. The class visits an actual stream and makes observations of the site. They use scientific...
Curated OER
Wetland vs. Stream Macroinvertebrates
A link to a comprehensive macroinvertebrate guide gives you the information needed to prepare for this field study activity. Sample macroinvertebrates are collected from areas representing different environmental conditions. Junior...
Curated OER
Missing Macroinvertebrates - Stream Side Science
Field study groups collect samples of stream water and identify the macroinvertebrates found. Using their data, they calculate a water quality index to rate the health of the stream. They graph their data and discuss the value of a water...
Curated OER
Raquel's Radishes
Sixth graders develop a reasonable hypothesis for a fictional science fair investigation. 'Raquel' is going to grow radishes and test for the best way to nourish them. They create a bar graph and write conclusions.
Curated OER
Unit III: 3
In this unit III: 3 worksheet, students describe motion in words and graph drawings. Students calculate the instantaneous velocity and average velocity. Students also graph the displacement of the object in the word problems.
Illustrative Mathematics
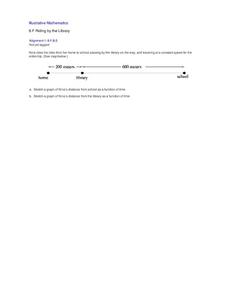
Riding by the Library
Draw a graph that shows the qualitative features of a function that has been described verbally. Make sure learners understand where time is zero and the distance is zero. It may take them some time to understand this concept, so working...
EngageNY
Increasing and Decreasing Functions 2
Explore linear and nonlinear models to help your class build their function skills. In a continuation of the previous lesson, learners continue to analyze and sketch functions that model real-world situations. They progress from linear...
Curated OER
Unit III: Worksheet 2 - Motion Maps
Make motion maps, draw graphical representations, and determine displacement. These are the activities included in this physics assignment. This is a great review of velocity, position, acceleration, and displacement concepts.
Curated OER
Unit 0 Review - Measurement Lab Equipment
Review questions like these can be used in your biology, chemistry, physics, or earth science classes! They assess scientists' understanding of laboratory measurement tools including graduated cylinders, thermometers, and balances. They...
Curated OER
Work-Kinetic Energy Theorem
Students prove the validity of the Work-Kinetic Energy Theorem by analyzing the Car and Driver website which lists qualitative and quantitative data about an assigned car. They decide whether or not they would purchase the car based on...
Curated OER
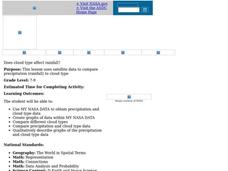
Does Cloud Type Affect Rainfall?
Student uses MY NASA DATA to obtain precipitation and cloud type data. They create graphs of data within MY NASA DATA. They compare different cloud types as well as precipitation types. They describe graphs of the precipitation and cloud...
Curated OER
Jelly Bean's Galore
Students investigate the origins of the Jelly Bean. They complete a Scavenger Hunt using the jellybean website. Pupils create a bar graph using information collected about jelly beans. Students discuss the time of year that Jelly Beans...
Curated OER
A Pox No Longer Upon Us
Tenth graders research the development and use of vaccines. They examine historical documents for qualitative observations and the basis of immunization. They examine primary and secondary immune responses as they relate to the...
Curated OER
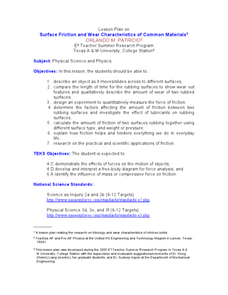
Surface Friction and Wear Characteristics of Common Materials
Students identify the factors affecting friction. In this physics lesson, students construct their own rocket car and race them. They graph the average speeds and discuss how lubricants affect friction between rubbing surfaces.
Curated OER
Rate Equations, Slope Functions and Concavity
For this rate equation worksheet, students identify an inflection value for given functions. They determine an expression that stultifies a given rate equation. This three-page worksheet contains definitions, explanations and examples....
Curated OER
I'm Inclined to See; Physics, Math, Science, Experiments, Graphs
Young scholars discover the motion of a sphere on an inclined plane and discover basic relationships involving distance, time, speed(velocity), and acceleration.
Curated OER
Questionnaires and Analysis
Students, review the techniques and different types of data analysis as well as how they are expressed, identify why facts and data are needed in conclusion of a questionnaire. The concepts of qualitative and quantitative data are...
Curated OER
Data Collection and Presentation
Students concentrate on discrete quantiative data. They are shown that the vertical line diagram as a more appropriate way to present discrete quantiative data then bar charts. Students work as a group to help with the interpretation...

