Hi, what do you want to do?
Curated OER
Definition and Applications of Computational Science
Students participate in a variety of instructional experiences about Computer Science. They define Computational Science and describe computational simulation. They also compare and contrast Computational Science and Computer Science.
Curated OER
It Takes All Kinds!
Students view video clips and observe similarities and differences between animals. They sort animals into groups for a zoo. They make a graph of their observations and review scientific classifications.
Curated OER
Transmission of Disease
Students provide names of viral diseases that they would possibly like to be infected with today; listing them on the Smart Board. They then come to an agreement about what virus to use and use beakers of fluids to simulate how viruses...
Curated OER
Wind Turbines
Students build their own wind turbine. In this physics instructional activity, students calculate the power output of their wind turbines. They evaluate their design and make the necessary modifications.
Curated OER
Graphs and Functions
Students are introduced to plotting functions on the Cartesian coordinate plane seen several categories of functions, including lines and parabolas
Curated OER
Micro-Magic With Sticky Ions
Students view a video about the formation of precipitates. They complete a worksheet that asks them to identify what makes a compound form and what holds it together.
Curated OER
Conversions That Make Cents
Eighth graders practice calculating problems using addition, subtraction, multiplication and division. They estimate solutions to algebraic problems. They also graph their solutions.
Curated OER
Social Studies: Canadian City Comparison
Pupils research Canadian population distribution while comparing and contrasting the quality of life in two cities. They discuss issues and problems that cities and rural towns face. Students apply various methods, such as graphs and...
Curated OER
A RealSim Surface Look at Descriptive Statistics
Learners explore the concepts of mean and variance. They observe properties of materials to their basic atomic or molecular structure. Students use spreadsheet software to record, tabulate and analyze collected information.
Curated OER
Revised “Understanding Nutrition” Activity
Students evaluate their current food choices. In this health science lesson, students test different drinks to rate the amount of Vitamin C content. They discuss results in class.
Curated OER
Physical Pendulum Lab
Learners calculate the moment of inertia of a disc. In this physics lesson, students differentiate the two methods used in finding the inertia. They construct their own pendulum for the lab.
Curated OER
Ecology: Adaptations
Eighth graders identify different types of adaptation in organisms. In this biology lesson, 8th graders explain how adaptation help organisms survive. They complete a worksheet at the end of the lesson.
Texas Education Agency
Texas Gateway: Data, Sampling, and Variation in Data and Sampling
This learning module discusses quantitative and qualitative data, the use of two-way tables in marginal and conditional distributions, how to display data, variation in data and samples, and how to critically evaluate statistical...
Cuemath
Cuemath: Discrete Data
A comprehensive guide for learning all about discrete data with definitions, the difference between discrete and continuous data, graphical representation of discrete data through visualization, solved examples, and interactive questions...
Texas Education Agency
Texas Gateway: Quantitative vs. Qualitative Data
This lesson explores quantitative vs. qualitative scientific data.
Other
U. Of Wisconsin: Formulating Statistical Questions and Collecting Data
This slideshow gives a detailed explanation of the characteristics of statistical questions and how they differ from other types of questions, the types of studies, and the methods for collecting data. It describes the case of Clever...
Vision Learning
Visionlearning: Data: Uncertainty, Error, and Confidence
An explanation of how errors may affect data that has been collected for experimentation. Some examples are given.
University of Illinois
University of Illinois: Data Types
The University of Illinois provides this site that is helpful because of the various kinds of data that can be collected. This lesson plan helps students differentiate between qualitative, quantitative, and many other types of data.
University of Georgia
University of Georgia: Inter Math: Types of Data
This site has a concise definition of "Data," plus examples of data types and collection methods.
Texas Instruments
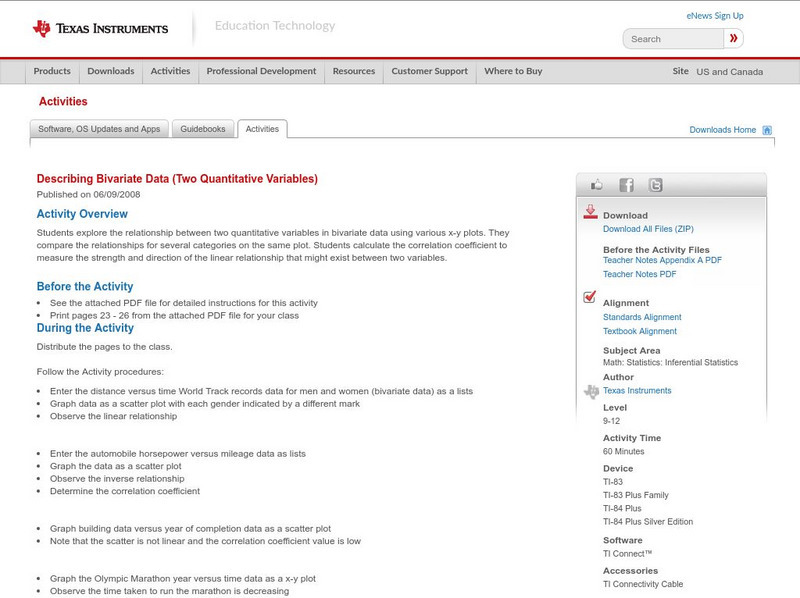
Texas Instruments: Describing Bivariate Data (Two Quantitative Variables)
Students explore the relationship between two quantitative variables in bivariate data using various x-y plots. They compare the relationships for several categories on the same plot. Students calculate the correlation coefficient to...
Oswego City School District
Regents Exam Prep Center: Categorizing Data
Three lessons on different types of data (qualitative, quantitative, univariate, bivariate, biased data) as well as a practice activity and teacher resource.
Other
Bscs: Asking and Answering Questions With Data
For this self-directed lesson, students use graphs and maps of water quality to investigate relationships between variables to answer questions. A handout with everything the student needs to complete this lesson is available as a PDF or...
CK-12 Foundation
Ck 12: Basic Graph Types
[Free Registration/Login may be required to access all resource tools.] Students will review the different types of graphs, and the differences between discrete and continuous data, and between qualitative and quantitative data. They...
Other
Bsi Education: Quantitative Analysis
The Applied Science resource consists of practical activities that demonstrate the importance of standard procedures in scientific work. Students analyze quantitative data through a variety of activities. An article, practice...


