Hi, what do you want to do?
Texas Instruments
Texas Instruments: Forensics Case 7 Drug Tests: Identifying an Unknown Chemical
In this activity, students distinguish between physical and chemical properties. They also understand the differences between qualitative and quantitative observations. They use quantitative and qualitative analyses to identify an...
TeachEngineering
Teach Engineering: Don't Confuse Your Qs!
Students investigate the difference between qualitative and quantitative measurements and observations. By describing objects both qualitatively and quantitatively, they learn that both types of information are required for complete...
Discovery Education
Discovery Education: Science of Everyday Life: How Strong Is It? [Pdf]
In this lesson plan students will learn how strong a Post-it notes adhesion really is! Students will experiment pulling a Post-It note to collect quantitative data to explore the adhesive properties of the note.
Concord Consortium
Concord Consortium: Stem Resources: Atoms and Energy
Online activity walks learner through exploration of kinetic and potential energy using animations. Through graphs, a quantitative connection is made between the movement and the energy involved. This information is then related to the...
Khan Academy
Khan Academy: Histograms Review
A histogram displays numerical data by grouping data into "bins" of equal width. Each bin is plotted as a bar whose height corresponds to how many data points are in that bin.
Khan Academy
Khan Academy: Stem and Leaf Plots Review
A stem and leaf plot displays numerical data by splitting each data point into a "leaf" (usually the last digit) and a "stem" (the leading digit or digits).
Khan Academy
Khan Academy: Linear Regression Review
Linear regression is a process of drawing a line through data in a scatter plot. The line summarizes the data, which is useful when making predictions.
Texas Education Agency
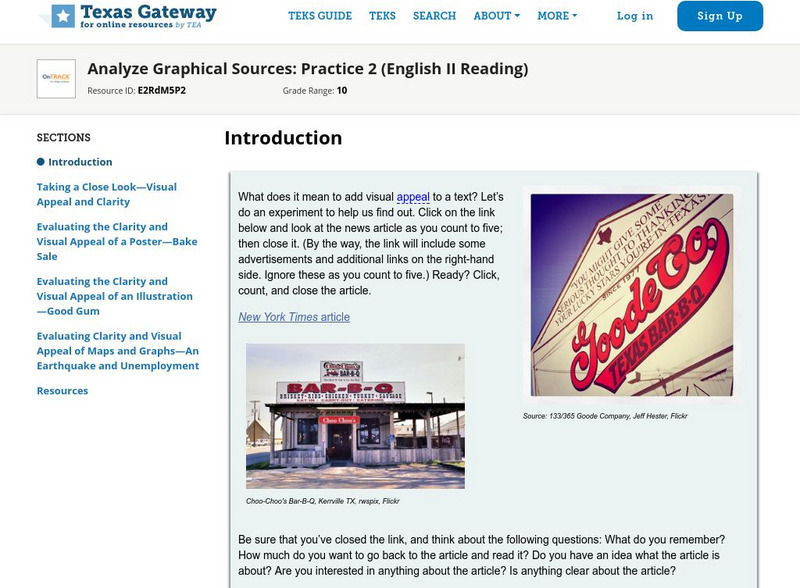
Texas Gateway: Analyze Graphical Sources: Practice 2 (English Ii Reading)
[Accessible by TX Educators. Free Registration/Login Required] Analyze the factual, quantitative, and technical data in graphs and charts.
Khan Academy
Khan Academy: Eyeballing the Line of Best Fit
Students practice informally graphing a line of best fit to a scatter plot and answer questions to determine if a scatter plot has a correlation. Students receive immediate feedback and have the opportunity to watch a video, get hints,...
Khan Academy
Khan Academy: Scatterplots and Correlation Review
A scatterplot is a type of data display that shows the relationship between two numerical variables. Each member of the dataset gets plotted as a point whose x-y coordinates relates to its values for the two variables.
Other
Nova Southeastern Univ: Research Paradigms and Meaning Making: A Primer [Pdf]
This paper is intended as an introduction to research methodology and how scientists construct meaning from a qualitative data analysis. (Published 2005)
Khan Academy
Khan Academy: Introduction to Residuals
Build a basic understanding of what a residual is.
Illustrative Mathematics
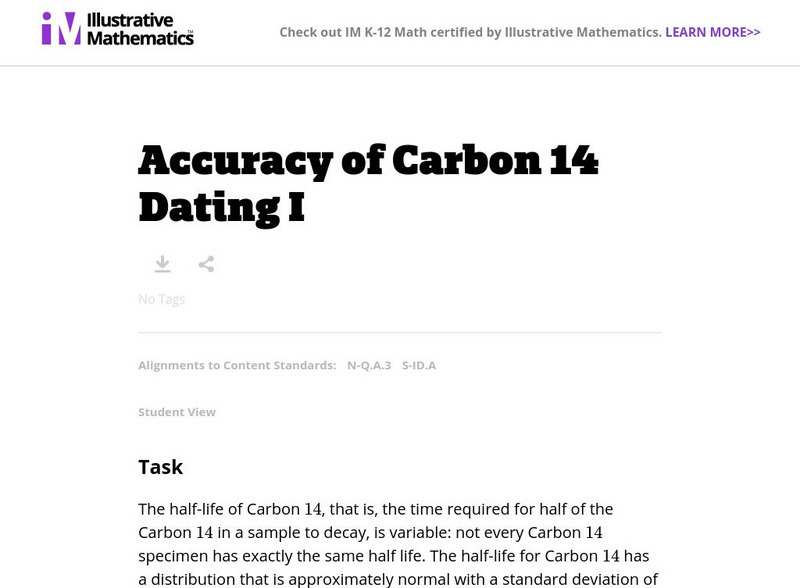
Illustrative Mathematics: N q.a.3 and S id.a: Accuracy of Carbon 14 Dating I
This task examines, from a mathematical and statistical point of view, how scientists measure the age of organic materials by measuring the ratio of Carbon 14 to Carbon 12. The focus here is on the statistical nature of such dating....
Science Education Resource Center at Carleton College
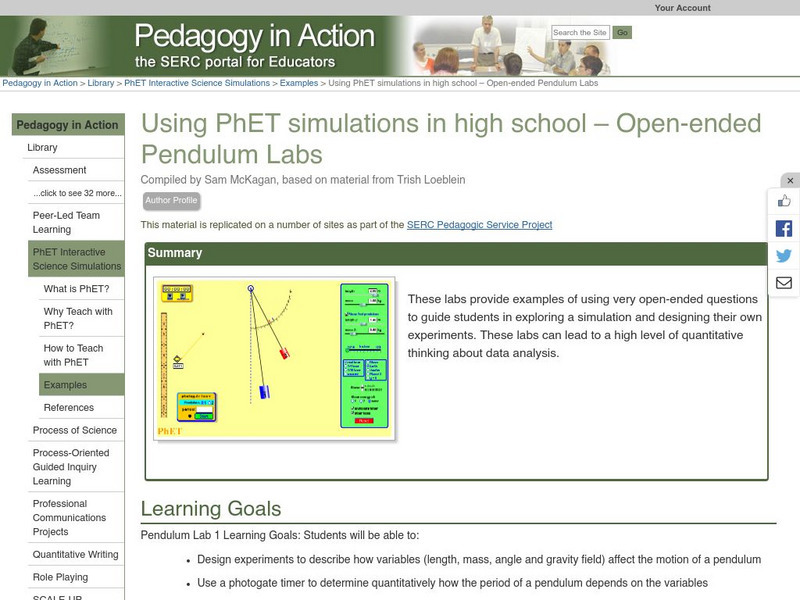
Serc: Using Ph Et Simulations in High School Open Ended Pendulum Labs
These labs provide examples of using very open-ended questions to guide students in exploring a simulation and designing their own experiments. These labs can lead to a high level of quantitative thinking about data analysis.
Texas Education Agency
Texas Gateway: Analyze Graphical Sources: Practice 2 (English I Reading)
Analyze the factual, quantitative, and technical data in graphs and charts.
Khan Academy
Khan Academy: Dot Plots and Frequency Tables Review
Dot plots and frequency tables are tools for displaying data in a more organized fashion. In this article, we review how to make dot plots and frequency tables.
Texas Education Agency
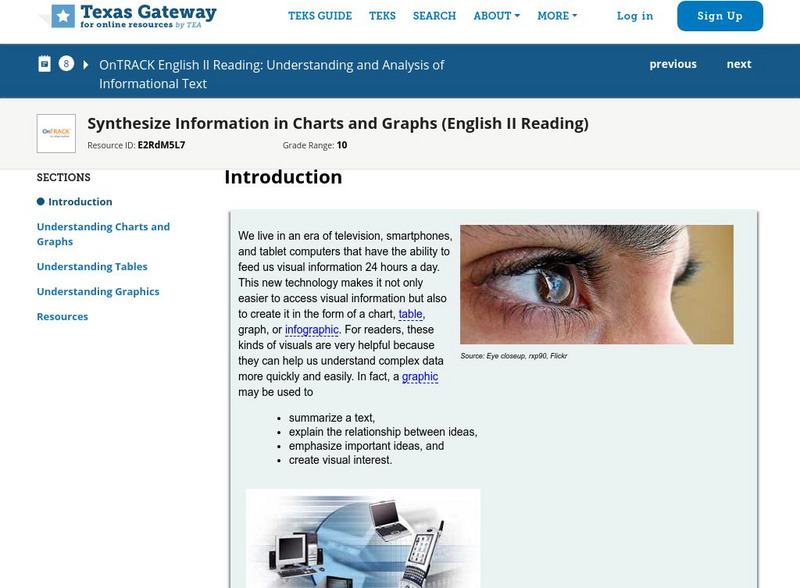
Texas Gateway: Synthesize Information in Charts and Graphs (English Ii Reading)
Synthesize information that you find in charts and graphs.
Lumen Learning
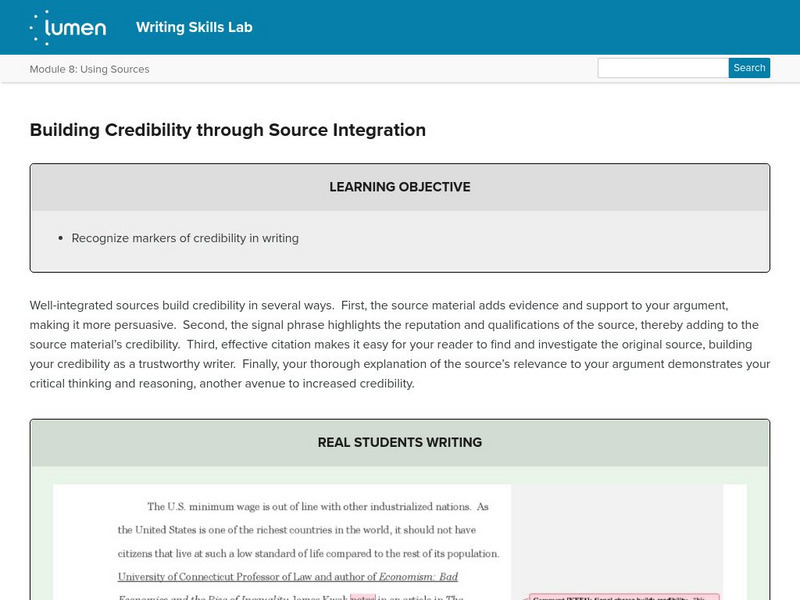
Lumen: Using Sources: Building Credibility Through Source Integration
This lesson focuses on building credibility by properly integrating source materials. It discusses three ways of improving credibility through integration, provides an example, and a practice exercise. SL.9-10.2 eval & integrate...
W. W. Norton
W. W. Norton: The Research Essay: Integrating Source Material Into the Essay
Information about integrating source material into an research essay. SL.11-12.2 Eval&Integrate sources
TED Talks
Ted: Ted Ed: Gary Wolf: The Quantified Self
Gary Wolf discusses how we use modern technology, more specifically gadgets and apps, to monitor our health and body. [5:11]
Other
The Topic: Charts and Graphs
Brief descriptions of charts and graphs, followed by links to larger sites on the same subject.
Khan Academy
Khan Academy: Correlation Coefficient Review
The correlation coefficient r measures the direction and strength of a linear relationship. Calculating r is pretty complex, so we usually rely on technology for the computations. We focus on understanding what r says about a scatterplot.


![Discovery Education: Science of Everyday Life: How Strong Is It? [Pdf] Lesson Plan Discovery Education: Science of Everyday Life: How Strong Is It? [Pdf] Lesson Plan](https://static.lp.lexp.cloud/images/attachment_defaults/resource/large/FPO-knovation.png)




![Nova Southeastern Univ: Research Paradigms and Meaning Making: A Primer [Pdf] Article Nova Southeastern Univ: Research Paradigms and Meaning Making: A Primer [Pdf] Article](https://content.lessonplanet.com/knovation/original/246161-1f2c0ae29b4b63e74270daf9a6a5b49c.jpg?1661550329)

