Curated OER
Cosmic Collisions and Risk Assessment
In groups, students create their own scientific impact experiments using ordinary materials, and observe and measure results with a variety of impacting bodies and velocities.
Curated OER
Smog City - Part I
Learners apply an interactive smog visualization application, Smog City to see how ozone levels are related to population levels and emissions. They study associated vocabulary and complete a worksheet.
Curated OER
A Pocketful of Change
Students study the meaning, symbolism, and value of U.S. coins,
especially the quarter. They conduct a survey of coins in students'
possession, graphing the results to show frequency distribution and drawing
inferences about the U.S....
Curated OER
Conversions That Make Cents
Eighth graders practice calculating problems using addition, subtraction, multiplication and division. They estimate solutions to algebraic problems. They also graph their solutions.
Curated OER
Streamflow
Pupils discuss the topic of streamflow and how it occurs. They take measurements and analyze them. They interpret data and create their own charts and graphs.
Curated OER
Nature of Meteor Showers
Ninth graders describe, in general terms, the distribution of matter in space and
identify evidence for, and describe characteristics of, bodies that make up the solar system. They then investigate predictions about the motion,...
Curated OER
Social Studies: Canadian City Comparison
Learners research Canadian population distribution while comparing and contrasting the quality of life in two cities. They discuss issues and problems that cities and rural towns face. Students apply various methods, such as graphs and...
Curated OER
Grade 2: Texas Problem Solving
Second graders use numerical data about Texas to write and solve real-life problems involving addition and subtraction (or multiplication and division). They work in pairs to choose three numerical facts about Texas to use to make up...
Curated OER
Double Dipping
Fifth graders find and display all possible pairs of flavors of ice cream and look for patterns in the results. They discuss strategies for finding all combinations of flavors. Students explain and write a description for the pattern...
Curated OER
And Around We Go!
Sixth graders conduct a survey and collect data to construct a bar graph that will then be changed into a circle graph. With the bar graph, 6th graders compare estimated fractions and percentages and estimate percentages. With the circle...
Curated OER
The Judiciary in American History
Students investigate the influence of political and societal forces on judicial decisions. Among the topics they examine are the selection of judges and the cause and effect relationship between politics, society, and the law. to...
Curated OER
Ecology: Adaptations
Eighth graders identify different types of adaptation in organisms. In this biology instructional activity, 8th graders explain how adaptation help organisms survive. They complete a worksheet at the end of the instructional activity.
Curated OER
Wind Turbines
Students build their own wind turbine. In this physics lesson, students calculate the power output of their wind turbines. They evaluate their design and make the necessary modifications.
Curated OER
How Big Is Your Heart?
Students complete a performance about the heart. In this heart lesson plan, students learn about the heart functions and then perform them.
Texas Instruments
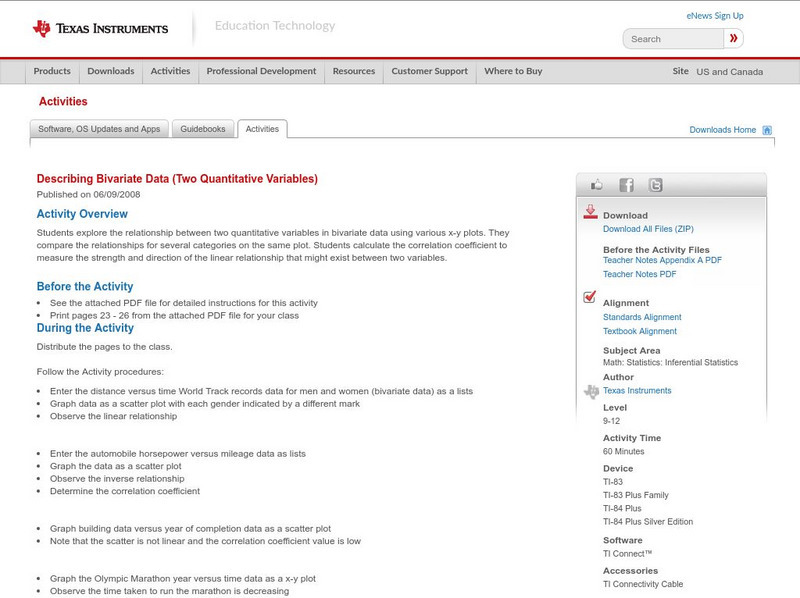
Texas Instruments: Describing Bivariate Data (Two Quantitative Variables)
Students explore the relationship between two quantitative variables in bivariate data using various x-y plots. They compare the relationships for several categories on the same plot. Students calculate the correlation coefficient to...
Science Education Resource Center at Carleton College
Serc: Quantitative Reasoning and Analytical Writing in a Global Climate Change
In this lesson students use Microsoft Excel to manipulate and statistically analyze large climate databases of precipitation., temperature, stream discharge, tree ring data, ice core data, and ENSO to determine climate relationships and...
Other
Bscs: Asking and Answering Questions With Data
In this self-directed lesson, students use graphs and maps of water quality to investigate relationships between variables to answer questions. A handout with everything the student needs to complete this lesson is available as a PDF or...
Shodor Education Foundation
Shodor Interactivate: Coloring Multiples in Pascal's Triangle
In this activity, the student can visually identify number patterns in Pascal's triangle by coloring multiples of a given number.
Oswego City School District
Regents Exam Prep Center: Categorizing Data
Three lessons on different types of data (qualitative, quantitative, univariate, bivariate, biased data) as well as a practice activity and teacher resource.
Illustrative Mathematics
Illustrative Mathematics: S Id Coffee and Crime
This task addresses many standards regarding the description and analysis of bivariate quantitative data, including regression and correlation. Given a scatter plot, students will answer a variety of questions about linear relationships,...
Illustrative Mathematics
Illustrative Mathematics: S Id.6 Used Subaru Foresters
Help Jane sell her Forrester! Using the data given, students will make an appropriate plot with well-labeled axes that would allow you to see if there is a relationship between price and age and between price and mileage. Students are...
Texas Instruments
Texas Instruments: How Do You Measure Up?
In this activity, students graph scatter plots to investigate possible relationships between two quantitative variables. They collect data and analyze several sets of data pairing the two quantities.
Khan Academy
Khan Academy: Linear Regression Review
Linear regression is a process of drawing a line through data in a scatter plot. The line summarizes the data, which is useful when making predictions.


