Hi, what do you want to do?
Granite School District
7th Grade CCSS Math Vocabulary Word List
Address key vocabulary in the seventh grade Common Core Math Standards with this comprehensive list. A series of word cards is also provided that supports each term with images and examples, making this an excellent tool for teaching the...
American Statistical Association
Chocolicious
To understand how biased data is misleading, learners analyze survey data and graphical representations. They use that information to design their own plans to collect information on consumer thoughts about Chocolicious cereal.
Curated OER
Questioning NASA
Space science and math collide in this inquiry that investigates launching times for antacid-tablet rockets! Upper elementary or middle school learners collect data as they launch these mini rockets. They apply concepts of place value...
American Statistical Association
Happy Birthday to . . . Two?
How many people do you need in a room before two likely share the same birthday? Scholars consider this puzzle by analyzing a set of data. They ponder how to divide the data and determine the proper size of a group for this event to...
American Statistical Association
Exploring Geometric Probabilities with Buffon’s Coin Problem
Scholars create and perform experiments attempting to answer Buffon's Coin problem. They discover the relationships between geometry and probability, empirical and theoretical probabilities, and area of a circle and square.
Statistics Education Web
Text Messaging is Time Consuming! What Gives?
The more you text, the less you study. Have classes test this hypothesis or another question related to text messages. Using real data, learners use technology to create a scatter plot and calculate a regression line. They create a dot...
Statistics Education Web
Consuming Cola
Caffeine affects your heart rate — or does it? Learners study experimental design while conducting their own experiment. They collect heart rate data after drinking a caffeinated beverage, create a box plot, and draw conclusions....
Curated OER
Using Bar Graphs to Understand Voting Patterns
Bar graphs are used as a way to study voting patterns in the United States. A variety of statistical data is presented in the graphs, and pupils must interpret the data in order to make a report to the class. Three excellent graphs,...
American Statistical Association
Bubble Trouble!
Which fluids make the best bubbles? Pupils experiment with multiple fluids to determine which allows for the largest bubbles before popping. They gather data, analyze it in multiple ways, and answer analysis questions proving they...
American Statistical Association
Step into Statastics
Class members study the size of classmates' feet and perform a statistical analysis of their data. They solve for central tendencies, quartiles, and spread for the entire group as well as subgroups. They then write a conclusion based on...
Curated OER
Brays Bayou Spiderwort Genetic Study
Students formulate hypothesis based upon data gathered by examining possible crosses of spiderworts using Punnett squares. They present explanations for physiological adaptations of spiderworts that resulted from interactions within the...
Curated OER
Foreign Language: Travel Brochure
Students research either French or Spanish speaking countries. After compiling information covering the geography, people,government, economy, and culture, they produce travel brochures on their respective countries.
Curated OER
Lesson 6-7: Scatter Plots and Equations of Lines
In this scatter plot worksheet, students examine tables and write a linear equation that matches the table. Students graph linear equations. They read scatter plots, determine the trend line, and write a linear equation to...
US Census Bureau
Population Pyramids
Visual representations of population distribution by age and sex for any country.
Other
University at Albany: Populations and Samples: The Principle of Generalization
This resource explains what generalization is in statistics, its advantages and disadvantages, and problems that can occur, e.g., sample or response bias. Includes detailed examples of sampling error and sample bias.
Khan Academy
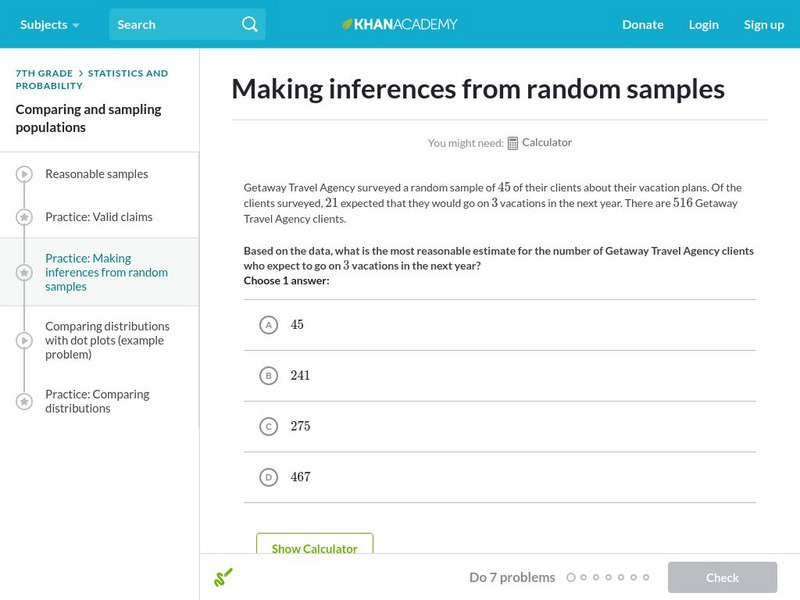
Khan Academy: Making Inferences From Random Samples
Practice making inferences from random samples.
Khan Academy
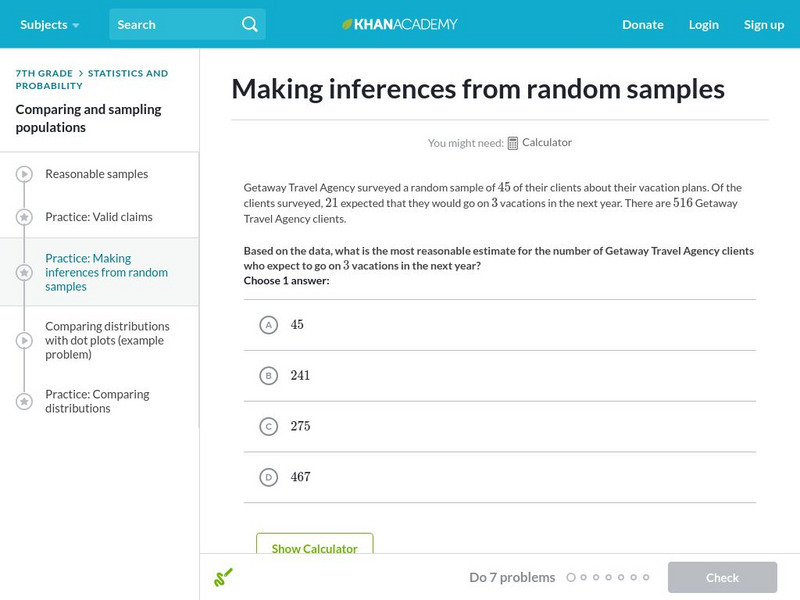
Khan Academy: Making Inferences From Random Samples
Practice making inferences from random samples.
Texas Education Agency
Texas Gateway: Generalizing About Populations From Random Samples
Given a population with known characteristics, students will be able to use a variety of methods to generate random samples of the same size in order to understand how a random sample is representative of a population.
Khan Academy
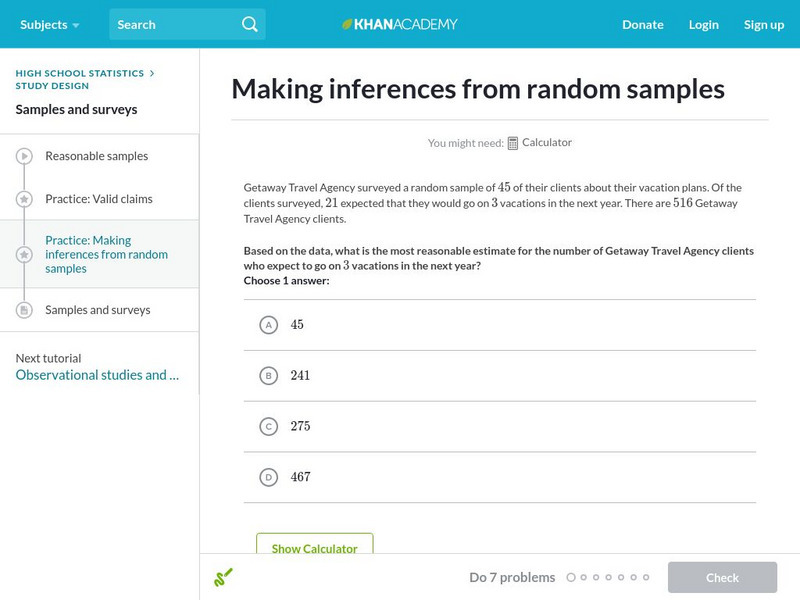
Khan Academy: Making Inferences From Random Samples
Given a random sample, practice figuring out what can we reasonably infer about the entire population? Students receive immediate feedback and have the opportunity to try questions repeatedly, watch a video or receive hints.
PBS
Pbs Learning Media: Estimation From Random Sampling
Practice estimating wildlife population by using the process of random sampling.
Other
Nearpod: Random Sampling
In this lesson, 7th graders will learn how to use random sampling to make generatlizations and predictions about a population.
CK-12 Foundation
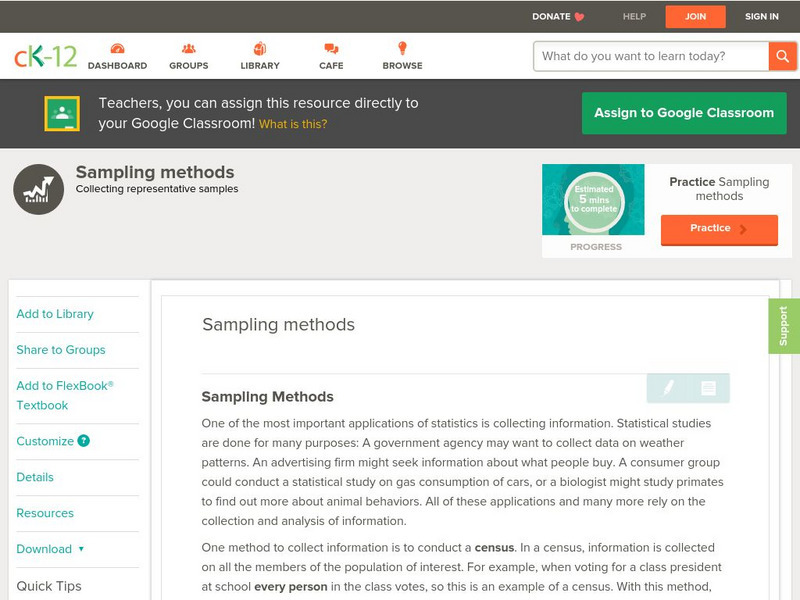
Ck 12: Statistics: Sampling Methods
[Free Registration/Login may be required to access all resource tools.] Decide how to choose a sampling of a population to produce reliable statistical results.
Science Education Resource Center at Carleton College
Serc: Reese's Pieces Activity: Sampling From a Population
Students use Reese's Pieces to investigate the proportion of orange candies present in a set of 25. After collecting data for the class, they use a web applet to collect more data for random samples. This is compared to the actual...
Sophia Learning
Sophia: Sampling: Lesson 4
This lesson will introduce the process of sampling. It is 4 of 7 in the series titled "Sampling."


