Ricochet Science
Mean, Mode, Median and Range
Viewers learn how to determine mean, median, mode, and range in the eighth installment of an 11-part Math in Science video series. The hard part's just remembering which is which!
Curated OER
What is the Median of a Data Set?
Mean, mode, median? What's the difference? How do you find them? The teacher focuses on explaining median in this video. She gives a good explanation and shows several examples using different sets of numbers.
Flipped Math
Describing Data
No need to nap through the lesson. Given data on the number of naps two teachers take, learners calculate the mean, median, mode, and range, and then interpret their results in terms of the context. They then see how to determine the...
Curated OER
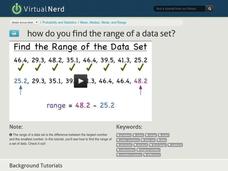
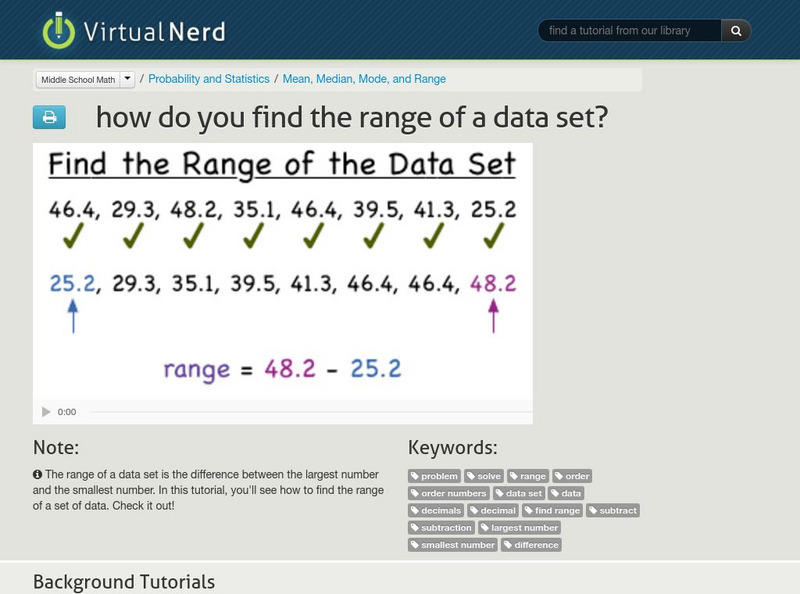
How Do You Find the Range of a Data Set?
Looking for the range of a set of numbers? Well, that means you are looking for the difference between the largest value and the smallest value. So first, write the numbers in order from least to greatest. Then identify the largest value...
Curated OER
How Do You Find the Mean of a Data Set?
There are eight decimals numbers in this data set. Find the mean. So add all the terms together and then divide that total number by the number of terms in the data set. That's how you find the mean or average of a data set.
Northeast Arkansas Education Cooperative
Using Measure of Central Tendencies
This short but information-packed presentation begins with a thorough review of how to calculate mean, median, and mode of a given data set. What makes it a unique lesson is the follow-up example and presentation of how these measures of...
Curated OER
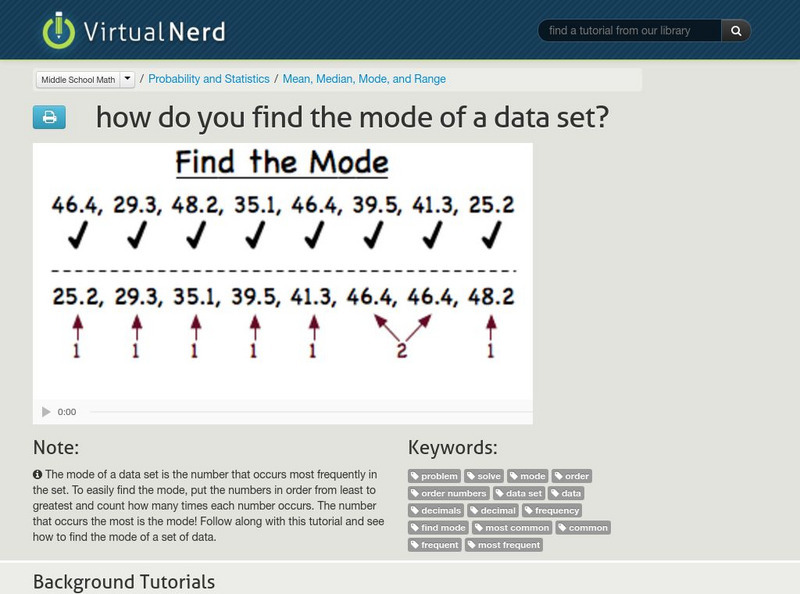
How Do You Find the Mode of a Data Set?
What is the mode of a data set? Mean, mode, median. Get confused in remembering which is which? Mode is the number that appears the most times in a data set. So given a data set, arrange the numbers in numerical value from least to...
Curated OER
What is the Mode of a Data Set?
Mode, the number that occurs most often. A data set could have one mode, no modes, or multiple modes. The teacher explains these variations and even gives some example of non-numerical data and how to figure out the mode.
Curated OER
What is the Mean of a Data Set?
Average, mean, average, mean. They are the same thing. So just use the formula for finding the average of a set of numbers to get the mean. Add up the value of the terms and then divide by the number of terms in the data set. There's the...
Crash Course
Measures of Spread: Crash Course Statistics #4
Sometimes the measures of center don't give us enough information. The spread of the data can tell statisticians much more about the data set. A video lesson, part of a statistics video series, describes different measures of spread such...
Virtual Nerd
Virtual Nerd: How Do You Find the Mode of a Data Set?
The mode of a data set is the number that appears most frequently. Learn how to find the mode of a data set with these examples in this tutorial. [3:07]
Virtual Nerd
Virtual Nerd: What Is the Mode of a Data Set?
Mode is a helpful measure of central tendency. Watch this video to see how to find mode with an explanation and examples. [4:36]
Virtual Nerd
Virtual Nerd: How Do You Find the Range of a Data Set?
The range is the difference between the largest number and the smallest number in a set of data. View this video for an explanation and examples of finding the range. [3:16]
Virtual Nerd
Virtual Nerd: How Do You Find the Mean of a Data Set?
Mean is another word for average. Learn how to determine the mean from a set of data. Watch this tutorial for an example. [3:13]
Virtual Nerd
Virtual Nerd: What Is the Mean of a Data Set?
Mean is the same thing as average when referring to a set of data. Watch this tutorial for an explanation and example. [4:05]
Virtual Nerd
Virtual Nerd: How Do You Find the Median of a Data Set?
The median of a data set is the number that is the middle value of the set. Watch this tutorial to learn how to find the median even if there are two middle values. [3:52]
Sophia Learning
Sophia: Comparing Measures of Central Tendency: Lesson 1
Compare and contrast the appropriateness of different measures of central tendency for a given data set and recognize how linear transformations of one-variable data affect the data's mean, median, mode, and range. This lesson is 1 of 3...
Sophia Learning
Sophia: Comparing Measures of Central Tendency: Lesson 2
Compare and contrast the appropriateness of different measures of central tendency for a given data set and recognize how linear transformations of one-variable data affect the data's mean, median, mode, and range. This lesson is 2 of 3...
Sophia Learning
Sophia: Comparing Measures of Central Tendency: Lesson 3
Compare and contrast the appropriateness of different measures of central tendency for a given data set and recognize how linear transformations of one-variable data affect the data's mean, median, mode, and range. This lesson is 3 of 3...
Sophia Learning
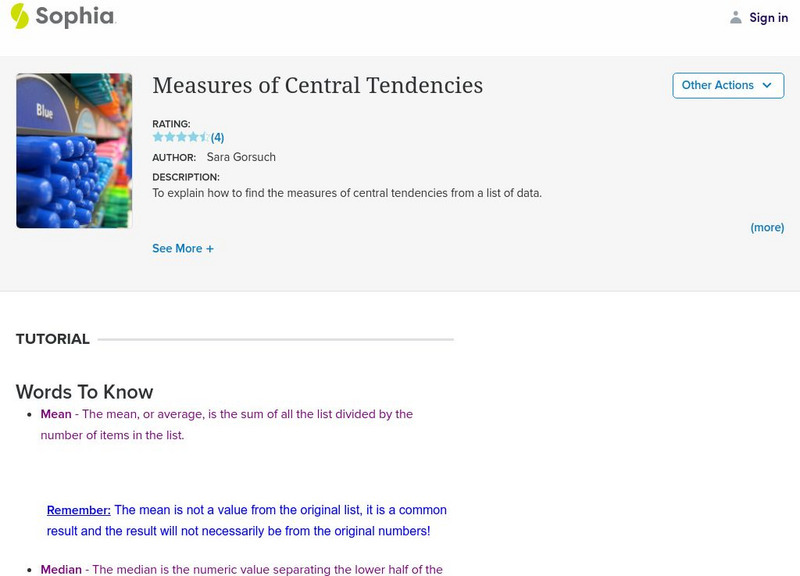
Sophia: Measures of Central Tendencies
This tutorial provides definitions and describes how to solve for the mean, median, and mode of a data set. It includes a PowerPoint with real-world examples of mean, median, and mode.
Texas Education Agency
Texas Gateway: Study Edge Statistics: Measuring Spread of a Distribution
This lesson looks at the different measures of center and variability that are used when analyzing the spread of data in a distribution. Includes downloadable study guide with exercises - guide also covers other topics. [17:21]
PBS
Pbs Learning Media: Real Life Math: Baseball
Watch and listen as the assistant general manager of a major league baseball team explains how he uses math in this video from KAET, Arizona PBS. A lesson plan and handouts are included. [7:43]
Loyola University Chicago
Math Flix: Statistics: Definitions and Review
This QuickTime movie provides a review of selected statistical definitions and applies them in an example. As you watch and listen to the teacher and student interact it helps clarify the thinking behind applying this concept.


