BW Walch
Creating and Graphing Linear Equations in Two Variables
This detailed presentation starts with a review of using key components to graph a line. It then quickly moves into new territory of taking these important parts and teasing them out of a word problem. Special care is taken to discuss...
Illustrative Mathematics
Accuracy of Carbon 14 Dating II
The scientific issue of carbon-14 dating and exponential decay gets a statistics-based treatment in this problem. The class starts with a basic investigation of carbon content, but then branches out to questions of accuracy and ranges of...
CK-12 Foundation
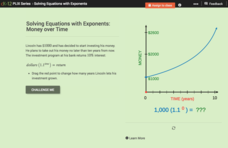
Solving Equations with Exponents: Money Over Time
We'd all like to see our money double. An interactive shows how an initial investment of $1,000 will increase using a constant rate of return. Scholars answer a set of challenge questions based on the situation.
Curated OER
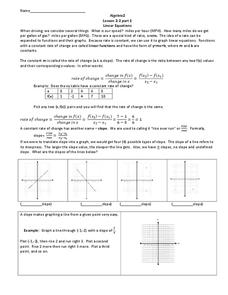
Linear Equations
Pre-algebra pupils examine the rate of change and how we can interpret it as a linear function. They are introduced to slope-intercept equations and graphs. Plenty of instruction is provided along with example problems. Note that even...
Balanced Assessment
On Averages and Curves
Determine the average on a curve. The class finds graphical representations of averages and expresses them both symbolically and on the graph. The assessment requires class members to justify using average to describe graphs.
Balanced Assessment
Bathtub Graph
Represent the relationship between independent and dependent variables through a modeling situation. The activity expects learners to graph the volume of water in a bathtub during a given scenario. The graph should result in two areas of...
Mathalicious
Domino Effect
Carryout the instructional activity to determine the cost of pizza toppings from a Domino's Pizza® website while creating a linear model. Learners look through real data—and even create their own pizza—to determine the cost of each...
Curated OER
Exploring the Exponential Function
Learners collect and analyze data regarding exponential functions of the form y = abx. Students explore the affects of changing parameters on the graph of the function.
EngageNY
Comparing Linear and Exponential Models Again
Making connections between a function, table, graph, and context is an essential skill in mathematics. Focused on comparing linear and exponential relationships in all these aspects, this resource equips pupils to recognize and interpret...
EngageNY
Comparing Linear Functions and Graphs
How can you compare linear functions? The seventh installment of a 12-part module teaches learners how to compare linear functions whose representations are given in different ways. They use real-world functions and interpret features in...
Cornell University
Math Is Malleable?
Learn about polymers while playing with shrinky dinks. Young scholars create a shrinky dink design, bake it, and then record the area, volume, and thickness over time. They model the data using a graph and highlight the key features of...
EngageNY
Mid-Module Assessment Task: Grade 7 Mathematics Module 4
Assess the ability of the class to solve percent problems with an assessment that covers a variety of percent problems from basic to multi-step. Pupils make connections between percent problems and proportional thinking to complete the...
EngageNY
Tax, Commissions, Fees, and Other Real-World Percent Problems
Pupils work several real-world problems that use percents in the 11th portion of a 20-part series. The problems contain percents involved with taxes, commissions, discounts, tips, fees, and interest. Scholars use the equations formed for...
Charleston School District
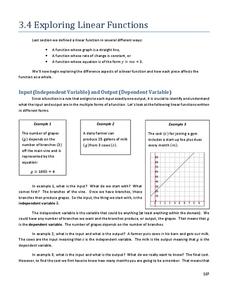
Exploring Linear Functions
What does a graph or equation say about a situation? Lots! The lesson uses the concepts explored in the previous four lessons in the series and applies them to problem solving situations. Learners create an equation from problems posed...
Inside Mathematics
Squares and Circles
It's all about lines when going around. Pupils graph the relationship between the length of a side of a square and its perimeter. Class members explain the origin in context of the side length and perimeter. They compare the graph to the...
Curated OER
A Simple Model for Atmospheric Carbon Dioxide
In this atmospheric carbon dioxide activity, students use two diagrams to solve 6 problems about atmospheric carbon dioxide. One diagram shows the Keeling Curve and the other shows sources of carbon and the natural and anthropogenic...
Curated OER
Finite Differences
Young mathematicians solve problems with polynomials. As they graph and analyze polynomial functions, learners define constant and finite, and determine the relationship between the constant set of differences and the slope of a linear...
Curated OER
The International Space Station
In this International Space Station instructional activity, students are given the altitude changes in the space station on a graph from 2000-2004. Students answer 5 questions about the trends in the graph, the changes in altitude, the...
Curated OER
Transformations and Exponential Functions
Tenth graders study graphing exponential functions. In this transformations lesson, 10th graders apply inquiry to determine how changes to a parent function affect its graph. Students analyze transformed graphs and generate the function...
Curated OER
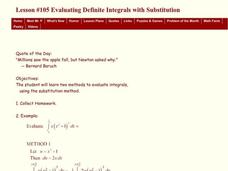
Evaluating Definite Integrals with Substitution
Students evaluate and define limits using substitution. For this calculus lesson, students apply the use of Integrals to explore Newton's law of Cooling. They solve rate and temperature problems using Integrals.
BW Walch
Creating Linear Equations in One Variable
The example of two travelers meeting somewhere along the road has been a stereotypical joke about algebra as long as algebra has existed. Here in this detailed presentation, this old trope gets a careful and approachable treatment....
Curated OER
Introduction to Mathematical Modeling
In this mathematical modeling activity, students answer two essay questions. They describe Newton's Law of Cooling by describing and constructing a model and answering seven essay questions about the process.
Curated OER
NUMB3RS Activity: Exponential Growth
Mathematicians investigate exponential growth by exploring two different options for receiving allowance. High schoolers use technology to compare a linear function with a constant rate of growth to a function that grows exponentially...
Curated OER
Every Graph Tells A Story
Seventh graders explore linear equations. In this graphing lesson, 7th graders explore constant rates of change. Students discover the real-life application of graphs and demonstrate their ability to read graphs and write corresponding...


