Curated OER
Chicken Pox Math
Students will listen to a story of a boy with chicken pox and participate in a class discussion of chicken pox and what to do when you have a contagious disease. They will incorporate math by graphing who in the class has had the...
Curated OER
Kid Garden Math
Students design a geometric garden. Shapes to be included are squares, triangles, and hexagons. After reading a book together about shapes, students get to use construction paper to cut out and design their own shape garden.
Curated OER
Integration and the "Barrier Breakers": Black Baseball 1945-1960
Learners explore integration of Major League Baseball, identify important individual baseball players who played key roles in integration, and analyze historical information through charts, graphs, and statistics.
Curated OER
Making a Map
Students are introduced to maps by examining the various types and practice using a key to find information. They each create their own map with a key and graph information. As a class, they read the story "Henny Penny" and share their...
Curated OER
The French in Texas
Fourth graders examine early French exploration and settlement in Texas. They read handouts, explore Internet websites and take notes, and create an illustrated journal with written entries.
Curated OER
New England Colonies
Students study the New England colonies. In this colonies lesson, students use a directed reading-thinking method to learn about the New England colonies. Students follow the method to make predictions, read the text, and analyze the...
Curated OER
Spaghetti Bridges
Eighth graders experiment with building bridges of spaghetti, pennies, and a cup to determine how varying the number of spagetti pieces affects the strength of the bridge. They graph their results and interpret the data.
Curated OER
Second Graders Create Their Own Social Studies Book (Part I, The 5Ws of the Constitution)
Students develop their own social studies textbook using a blank theme book as they complete activities and learning experiences throughout the year. The activities are in art, music, simulations, read alouds, shared writing and a class...
Curated OER
Great Flathead Lake Ecosystem Mystery
Learners analyze data to solve the mystery of what contributed to an ecological disaster at Great Flathead Lake. They read and graph the available data, create a food web of the problem ecosystem, and construct a formal problem statement...
Curated OER
Why Plants Are Important to Us
First graders explore plant life. In this plant lesson, 1st graders examine various plant life and categorize them. Students graph their data and make journal entries regarding their work.
Curated OER
The Hudson's Ups and Downs-Hudson River Activity
In this Hudson River worksheet, learners read a short passage about the river, compare graphs of water levels at different locations, label high and low tides on a graph and interpret, and answer comprehension questions based on several...
Curated OER
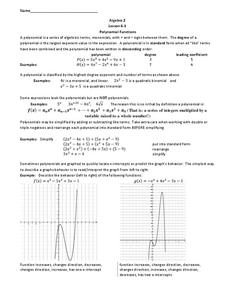
Polynomial Functions
In this Algebra II worksheet, 11th graders classify polynomials by degree, write in standard form, and describe the behavior of the graph. The two page worksheet provides explanation and examples along with thirteen practice...
Curated OER
Cartesian Coordinate System
Students explore the Cartesian coordinate plane and plot points on the graph. They interpret coordinates for a point from the graph and give the ratio of rise over run for slope.
Curated OER
The Stock Market-Tracking and Picking Stocks
Students interpret the stock market. They pick preferable stocks based on price to earnings ratios listed in the quotes. They practice using fractions and decimals to calculate the cost of selling and buying various stocks using...
Curated OER
Peer Pressure
Young scholars talk about how their peers can influence their behavior. In this peer pressure lesson plan, students complete a KWL chart on peer pressure, read a handout on peer pressure and break into groups to discuss the information....
Curated OER
Are you an Energy Saver STAR?
Learners examine how to use energy more efficiently in their own home. They collect data from their home, complete a chart, read a power meter, interpret the data from an electric and gas bill, and create a poster demonstrating how to...
Curated OER
Mathematical Magazines
Students classify and tabulate the type of advertisements found in a collection of magazines. Determination is made on what percent of the total number of ads each type represents. They present their results orally and in a graph.
Curated OER
A Country’s Shape Is More Than Its Borders
In this geography skills worksheet, students read an article and examine graphs about population prior to answering 13 short answer questions and 10 multiple choice questions. Students then respond to the writing prompt about population.
Curated OER
Who Do You Want For Your Friend?
Second graders create a t-chart about the healthy and unhealthy characteristics in relationships. They discuss elements they should look for in a friend. They are read books to identify these elements.
Curated OER
T-Shirt Glyph
Students create a glyph (a symbol or icon) that represents who they are, and read the glyphs of others to explain the glyphs' data.
Curated OER
1st Grade - Act. 03: T-Shirt Glyph
First graders create glyphs (symbols or icons) which represents them, and read the glyphs of others using a legend to explain the data on the glyphs.
Curated OER
The Immigrant Experience
Young scholars utilize oral histories to discover, analyze, and interpret immigration and migration in the history of the United States. A goal of the unit is fostering a discussion and encouraging students to make meaning of the bigger...
Curated OER
Charting Animal Life Spans
Second graders research animal life spans and complete related math activities. In this life span lesson, 2nd graders read How Many Candles and discuss life spans. Students arrange animal cards based on their life spans. Students find...
Curated OER
Evaluating Data
In this data activity, students learn how to organize the data collected during an experiment and practice finding patterns. Students graph a table of experimental data and complete 1 short answer question.


