Curated OER
Kidsville USA
Second graders create an imaginary town using Kid Pix. They demonstrate their knowledge of specific vocabulary words and their knowledge and understanding of location by placing schools, stores, parks, etc. appropriately on their maps.
Curated OER
Geography: African Floor Maps
Students explore the African continent and identify the various countries there. They examine the history, geography, environment, and inhabitants of the countries. Students create maps of Africa using a variety of materials.
Curated OER
Oregon Rainshadows
Students brainstorm list of possible highest locations in Oregon, identify and label places from list on map using color code, and discuss and identify causes of a rain shadow.
Curated OER
Global Perceptions: How Your Students View the World
Students examine their own perceptions and attitudes about places around the world. Using their mental maps, they compare and contrast it with a world map from different periods in history. They review the various types of map...
Curated OER
Central Oregon Road Trip
Young scholars work together to plan a six-day road trip through central Oregon. Using a map, they locate any place mentioned and create a list of attractions throughout the area. They list the places in the order they are going to visit...
Curated OER
Growing Up
Students solve a given problem and explain their thinking using two number sentences to match their answer. One number sentence must use addition, one must use multiplication, and students must explain their answers. Includes sample...
Curated OER
Virtual Field Trip
Students calculate gasoline cost per mile on a virtual field trip. They calculate the gasoline costs and travel time for each of the 2 routes, and record on a data sheet. They use Excel to create data tables for mileage, gasoline...
Curated OER
Language Arts- Word Origins
Sixth graders locate, access, and select appropriate information from a variety of resources, including electronic sources. They analyze the audience and purpose of the task to make decisions about content and format.
Curated OER
Wind Turbines
Students build their own wind turbine. In this physics instructional activity, students calculate the power output of their wind turbines. They evaluate their design and make the necessary modifications.
Education Development Center
Tune in to Learning: Reading Charts and Graphs
Practice graph reading skills with these exercises and companion tutorials.
Primary Resources
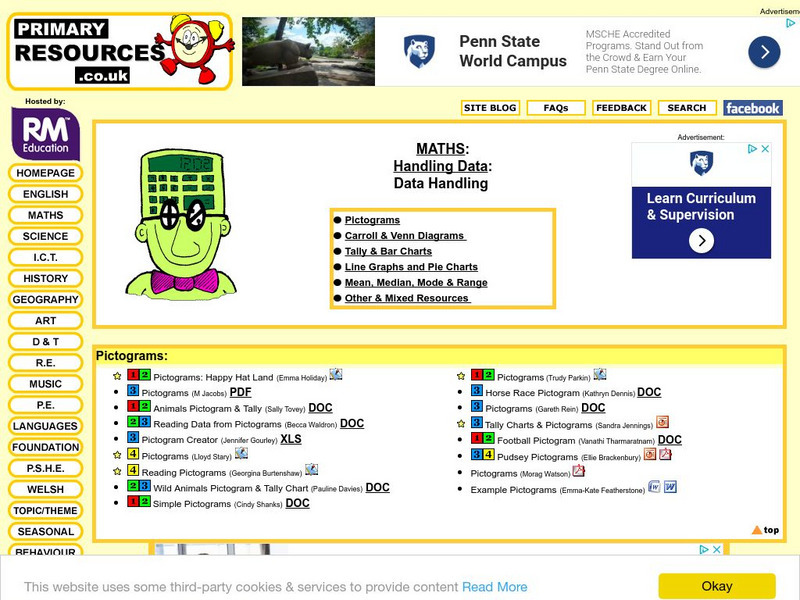
Primary Resources: Tally and Bar Charts
Lots of good materials for teaching about tally marks and bar graphs.
Quia
Quia: Reading Charts and Graphs Quiz
This 25-question quiz asks students to read various kinds of charts and graphs and to select the correct answers to the questions. Immediate feedback is provided after each question. Java is required.
Khan Academy
Khan Academy: The Sat Reading Test: Overview
This is an overview of what to expect on the SAT Reading Test. It assesses your ability to read and interpret a variety of texts similar to the reading you will find in college and your career. All of the questions on the reading test...
Khan Academy
Khan Academy: Read Histograms
Practice reading and interpreting histograms. Students receive immediate feedback and have the opportunity to try questions repeatedly, watch a video or receive hints.
CK-12 Foundation
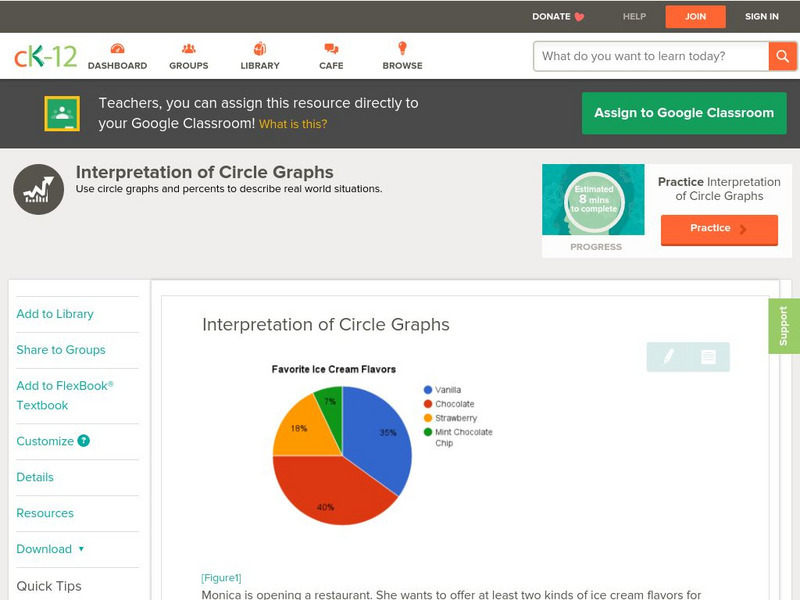
Ck 12: Statistics: Interpretation of Circle Graphs Grades 6 7
[Free Registration/Login may be required to access all resource tools.] Read and interpret circle graphs.
Khan Academy
Khan Academy: Interpreting Graphs of Proportional Relationships
Practice reading and analyzing graphs of proportional relationships. Students receive immediate feedback and have the opportunity to try questions repeatedly, watch a video or receive hints.
Khan Academy
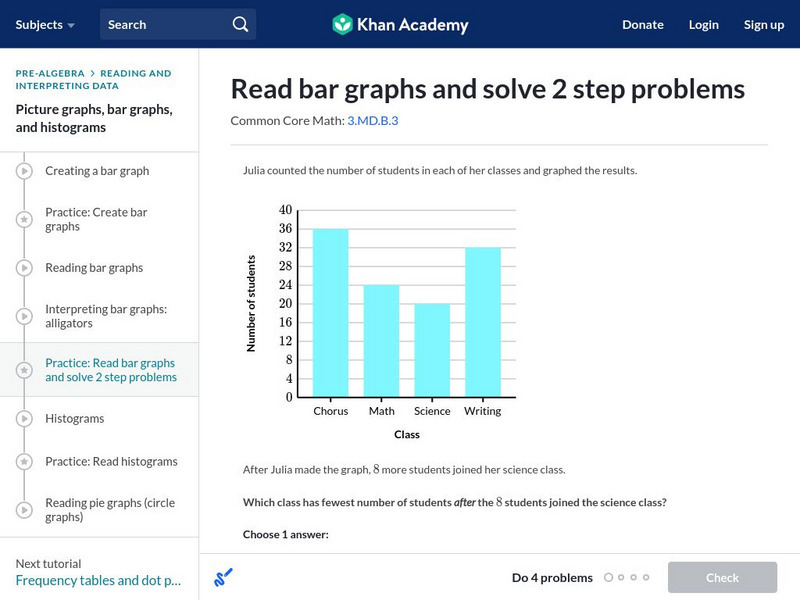
Khan Academy: Read Bar Graphs and Solve 2 Step Problems
Read and interpret a double bar graphs. Students receive immediate feedback and have the opportunity to try questions repeatedly, watch a video or receive hints. CCSS.Math.Content.3.MD.B.3 Draw a scaled picture graph and a scaled bar...
Khan Academy
Khan Academy: Solve Problems With Bar Graphs 1
Read and interpret bar graphs. Students receive immediate feedback and have the opportunity to try questions repeatedly, watch a video or receive hints.
Texas Education Agency
Texas Gateway: Analyze Graphical Sources: Practice 2 (English I Reading)
This lesson focuses on practice exercises to understand and interpret the data in a graphic representations including pie charts, bar graphs, and line graphs.
Shodor Education Foundation
Shodor Interactivate: Lesson: Reading Graphs
Presents an introductory instructional activity to teach students how to read and plot graphs and determine functions based on graphs.
Education Place
Houghton Mifflin: Eduplace: Make a Living Bar Graph
Student use simple data to line up in a living bar graph activity when they respond to simple questions in this lesson plan. They physically and visually represent the data. CCSS.Math.Content.3.MD.B.3 Draw a scaled picture graph and a...
Khan Academy
Khan Academy: Solve Problems With Picture Graphs 1
Read and interpret picture graphs. Students receive immediate feedback and have the opportunity to try questions repeatedly, watch a tutorial video, or receive hints.
University of Cambridge
University of Cambridge: Nrich: The Pet Graph
On this one-page website, sharpen your logic and graph reading skills by figuring out which pet goes with each bar on the graph. The solution is available to double check your own solution.
Texas Education Agency
Texas Gateway: Evaluating Data in Tables, Graphs and Charts
[Accessible by TX Educators. Free Registration/Login Required] In this lesson students look at examples of graphics, tables, charts, and graphs, and learn how to interpret their data. They will be able to use this skill to enhance their...


