Curated OER
Bar Graphs With Intervals
Give your math class a comprehensive understanding of bar graphs with this series of lessons. The resource is divided into three parts, and all of the accompanying worksheets are included. The class will study different bar graphs,...
Curated OER
Read My Bar Graph!
Elementary schoolers make and use bar graphs to picture information. They learn how choosing the right scale for a bar graph can help make a persuasive argument. This is a terrific lesson on graphing which should excite your kids. There...
Curated OER
Using Bar Graphs to Understand Voting Patterns
Bar graphs are used as a way to study voting patterns in the United States. A variety of statistical data is presented in the graphs, and pupils must interpret the data in order to make a report to the class. Three excellent graphs,...
Curated OER
Going Graph-y
Second graders listen to and dicuss the story Where the Wild Things Are. They play a pantomime game and act out various feelings so their classmates can guess. They listen for the frequency of certain words, and record their findings on...
Curated OER
Chocolate Graphing
Chocolate lovers develop a bar graph based on the types of chocolate the class likes. They participate in The Art of Chocolate at The Hershey Story before they make a bar graph that shows the favorite chocolate types of their class. They...
Curated OER
Great Graph!
Here is a fantastic lesson counting coins, interpreting graphs, and the concept of "greater than" and "less than." Young mathematicians utilize worksheets embedded in the plan in order to practice these concepts. The worksheets are...
Illustrative Mathematics
Favorite Ice Cream Flavor
What better way to engage children in a math instructional activity than by talking about ice cream? Using a pocket chart or piece of chart paper, the class works together creating a bar graph of the their favorite ice cream flavors....
Curated OER
Create a Graph Online
Scholars create colorful bar, line, or pie graphs. They decide on a survey question to ask or a type of data to gather. From there, they collect information and data. They display this data in bar, line, or pie graphs that they create...
Curated OER
Bar Graphs
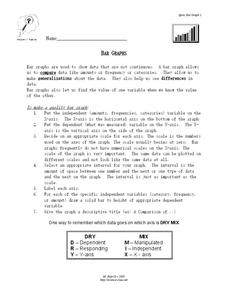
In this bar graph worksheet, students read about making quality bar graphs and they make a bar graph using given data. They answer 5 questions about their graph.
Curated OER
Best-Selling Books Bar Graph
Create a bar graph with your elementary school learners. First they read and interpret data, and then they color in the graph (provided) to indicate how many of each were sold. Consider providing them with the data but having them...
Curated OER
Reading and Interpreting Graphs
In this reading and interpreting graphs worksheet, students answer 8 word problems that involve reading information from a graph about pizzas. Students then review a second graph centered on music and answer 12 questions.
Curated OER
Show Me The Data!
Pupils create a bar graph. They will collect and organize data to turn into bar graphs. They create graphs for the favorite sports of the class, color of M&M's, and types of cars passing by.
Curated OER
Cutting Expenses
Students explore budgeting. In this finance and math lesson, students brainstorm ways in which households could save money. Students view websites that give cost reducing ideas. Students complete an expense comparison chart and use the...
Curated OER
Nutrition and Food Security
Examine the three basic nutrients and their effects on the body. Fifth graders will research data to construct a bar graph and then demonstrate the relationship between malnutrition and food security. This is a very comprehensive...
Curated OER
Call it "Macaroni"
Who knew there were so many fun educational opportunities featuring pasta? Scholars read a brief informational text about the history of pasta (note that "macaroni" is spelled two different ways, so address this if kids are reading...
Curated OER
Rubber Band Banza
Third graders review ideas about sound and vibration to make their own stringed instrument. They review what a pictograph and bar graph are. Pupils conduct a survey within the classroom to choose the four favorite string instruments and...
Curated OER
Drive the Data Derby
Three days of race car design and driving through the classroom while guessing probability could be a third graders dream. Learn to record car speed, distances traveled, and statistics by using calculation ranges using the mean, median,...
Curated OER
Build A Skittles Graph
Young scholars explore graphing. In this graphing lesson plan, students sort Skittles candies and use the color groups to create a bar graph. Rubrics and extension activities are provided.
Curated OER
All About Graphs
Students practice organizing data by creating graphs. In this statistics instructional activity, students survey the class about favorite colors and create a bar graph using the data. Students complete a test based on pet and animal...
Curated OER
Bar Graph Lesson
Young scholars make a bar graph. In this graphing lesson, students discuss why bar graphs are used and are shown bar graph examples. Young scholars create their own bar graph to compare the heights of different things around the world....
Curated OER
Bar Charts and Pictographs: How can they help us?
First graders work with manipulatives to solve various math problems by using concrete objects to solve a list of problems . They create and evaluate bar graphs and write a statement about the information on their bar graph.
Curated OER
Bar Graphs
In this bar graphs worksheet, pupils, working with a partner, explore how to read and analyze the five answers to one mathematical bar graph.
Curated OER
What's Data?
Learners get the opportunity to investigate the concept of data collecting. They explore how to tally and read a bar graph. Vocabulary about data is also be included. At the end of the lesson, individual students collect data independently.
Curated OER
Curious Clouds
Second graders explore clouds. They read The Cloud Book by Tomie dePola. Students sort the cloud pictures into three categories. Students create a graph using the cloud pictures. They use Excel to create a bar graph.


