Curated OER
Weather, Data, Graphs and Maps
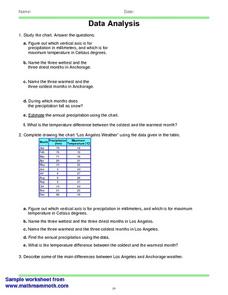
Learners collect data on the weather, graph and analyze it. For this algebra lesson, students interpret maps and are able to better plan their days based on the weather reading. They make predictions based on the type of clouds they see.
EngageNY
Estimating a Population Proportion
Find the percent of middle schoolers who want the ability to freeze time. The 21st installment in a series of 25 has groups collect a random sample of respondents who answer a question about superpowers. Using sample statistics,...
Curated OER
Obstacles to Success: Misleading Data
Eleventh graders explore how data reported by country agencies can mislead the public intentionally or unintentionally. In this Cross Curricular activity, 11th graders analyze charts and graphs in order to draw conclusions. Students...
Curated OER
Ornithology and Real World Science
Double click that mouse because you just found an amazing lesson! This cross-curricular Ornithology lesson incorporates literature, writing, reading informational text, data collection, scientific inquiry, Internet research, art, and...
Curated OER
Historical Population Changes in the US
Students conduct research on historical population changes in the U.S. They conduct Internet research on the Historical Census Data Browser, create a bar graph and data table using a spreadsheet program, and display and interpret their...
Curated OER
Wind Effects- A Case Study
Learners explore hurricanes. For this weather data interpretation lesson, students draw conclusions about the impact of Hurricane Floyd as it related to weather conditions. Learners read and interpret a tide data table, a barometric...
Curated OER
Reading the Neighborhood
First graders complete activities with the story One Monday Morning in the Macmillan/McGraw Hill Textbook. For this data lesson, 1st graders read the story and gather data to create a picture graph. They read the graph and answer...
Curated OER
Data Collection and Presentation
Students access how to collect, classify and display data involving statistics. The concepts of quantitative, discrete and continuous data is covered in depth within the lesson. They practice with a scenario of James filled with...
Towson University
Looking Backwards, Looking Forward
How do scientists know what Earth's climate was like millions of years ago? Young environmental scholars discover how researchers used proxy data to determine the conditions present before written record. Grouped pupils gain experience...
Inside Mathematics
Population
Population density, it is not all that it is plotted to be. Pupils analyze a scatter plot of population versus area for some of the states in the US. The class members respond to eight questions about the graph, specific points and...
Curated OER
Evaluating Data
In this data worksheet, students learn how to organize the data collected during an experiment and practice finding patterns. Students graph a table of experimental data and complete 1 short answer question.
Curated OER
Big Boats Up The River
Using boats along in the Port of Albany as the focus, learners practice adding single-digit numbers and interpreting data. This lesson comes with the worksheets, resource links, and other materials to make it a worthwhile experience.
Curated OER
Data Analysis, Probability, and Discrete Mathematics: Lesson 4
Eighth graders investigate the concepts of probability while performing data analysis. They apply statistical methods in order to measure or predict some possible outcomes. The information is collected and graphed, 8th graders analyze...
Curated OER
Data Analysis 2
In this data analysis worksheet, learners read and interpret given line graphs. They determine the range and average. This one-page worksheet contains five problems.
Laboratory for Atmospheric and Space Physics
The Planets and Scale
Scholars gain an insight into the relative size of planets and distance between inner and outer planets with the help of informational text, a data table, and a series of four questions.
Mathed Up!
Pie Charts
Representing data is as easy as pie. Class members construct pie charts given a frequency table. Individuals then determine the size of the angles needed for each sector and interpret the size of sectors within the context of frequency....
Curated OER
All in the Family
Students use data to make a tally chart and a line plot. They find the maximum, minimum, range, median, and mode of the data. Following the video portion of the lesson, students will visit a Web site to test their data collection skills...
Curated OER
Raisin the Statistical Roof
Use a box of raisins to help introduce the concept of data analysis. Learners collect, analyze and display their data using a variety of methods. The included worksheet takes them through a step-by-step analysis process and graphing.
Curated OER
Digger and the Gang
Help online friends Digger and Sprat from the BBC series to solve math problems! In a series of activities, your class will use data sets to calculate measurements, averages, means, and probabilities. The class completes worksheets and...
Albert Shanker Institute
Economic Causes of the March on Washington
Money can't buy happiness, but it can put food on the table and pay the bills. The first of a five-activity unit teaches pupils about the unemployment rate in 1963 and its relationship with the March on Washington. They learn how to...
Curated OER
How Do You Read Stock Quotes Online ?
Students explore how to get and interpret stock price data online. They also describe certain aspects of various corporations and know the meanings of important terms involving the stock market.
Curated OER
All Choked Up By Smoking Statistics
Scholars use the article "More College Students Are Smoking, Study Says" as a springboard for discussion on the reasons why people smoke cigarettes. They investigate different methods of graphing statistics by using the data provided in...
Curated OER
Using Pictographs With Data
In this using pictographs with data learning exercise, 3rd graders read data from a pictograph to answer ten multiple choice questions. Answers can be shown on the screen.
University of Georgia
Freezing and Melting of Water
Examine the behavior of energy as water freezes and melts. An engaging activity provides a hands-on experience to learners. Collaborative groups collect data and analyze the graphs of the temperature of water as it freezes and then...


