Curated OER
Cindy and Linda - Selling Lemonade
In this pie charts activity, students use the pie chart to count how many glasses of Lemonade were sold by Cindy and Linda. Students complete the table and answer 3 questions.
Curated OER
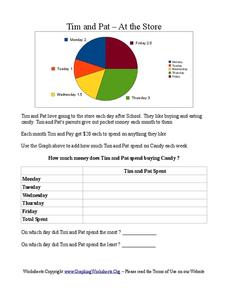
Tim and Pat - At the Store
In this pie chart worksheet, students use the pie chart to add the amount of time Tim and Pat spend buying candy each day of the week. Students answer 2 questions about the table.
Curated OER
Count The Letters
Students perform activities involving ratios, proportions and percents. Given a newspaper article, groups of students count the number of letters in a given area. They use calculators and data collected to construct a pie chart and bar...
Curated OER
Data Analysis, Probability, and Discrete Mathematics
Fourth graders analyze the data in a bar graph, pictograph, line graph, and a chart/table and draw conclusions based on the data. They discuss each type of graph, write questions for each graph, and analyze the data as a class.
Curated OER
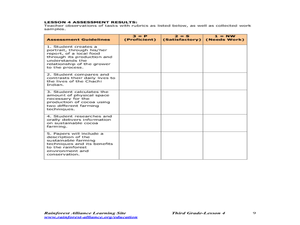
Equadorian Rainforest: The Tropical Supermarket
Young scholars study the concept of sustainable agricultural practices through cocoa farming and the lives of the people who are the producers. Students watch a slide show and read a story which helps them understand the origins of...
Bowland
Mystery Tours – Plan Your Tour
Everyone loves a vacation and a set of three activities has groups planning a tour of the U.K. using given distance, time, and price data. They solve a variety of problems related to the trip and produce a report on the success of the trip.
Curated OER
Virtual Field Trip
This hands-on resource has future trip planners analyze graphs of mileage, gasoline costs, and travel time on different routes. While this was originally designed for a problem-solving exercise using a Michigan map, it could be used as a...
Curated OER
Virtual Field Trip
Are we there yet? Young trip planners learn about their state and plan a trip. They will select sites to see in three cities in their state, and record associated costs in a spreadsheet. While this was originally designed as a...
Curated OER
Colorful Fractions
Students use charts to show fractions. In this fractions and percents lesson, students review fractions, percents and ratios. Students create tables and color the cells to make different fractions. Students answer questions about each...
Curated OER
Graphing Favorite Fruit
Third graders take poll and sort data, enter the data to create a spreadsheet and create bar and pie graphs.
Curated OER
Power and Auroras
In this power and auroras worksheet, students read about the relationship between power, work and energy and how the power of auroras are measured by the light they produce. Students use a data chart of the Great Aurora of 2003 to answer...
Curated OER
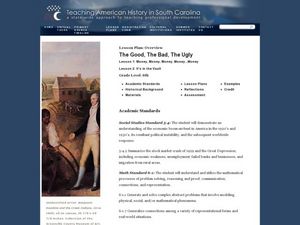
The Good, The Bad, The Ugly
Sixth graders examine the causes of the stock market crash of 1929. In this integrated math/history unit on the stock market, 6th graders study, research, and read stocks, visit a local bank, and create a PowerPoint to show the finished...
Curated OER
Making Simple Conversions
Fourth graders explore unit conversions. They create visual models of measurement units, identify tables of equivalent units and make simple conversions with in a measurement system. Students produce charts that identify units of measure...
Curated OER
Wiggle Worms
First graders investigate worms, collect and analyze data. In this worm and data lesson, 1st graders listen to Chick and Duckling from the Macmillan/McGraw-Hill reading series. They conduct experiments with worms, collect simple data,...
Curated OER
Measuring Soil Temperatures at South Penquite Farm
Students investigate soil temperatures. In this graphing and earth science instructional activity, students insert temperature probes into different types of soil at varying depths. Students complete a data chart and construct a related...
Curated OER
Yummy Apples!
Learners discuss apples and how they are grown. They listen as the teacher reads "Apples," by Gail Gibbons. Students discuss the story. They view several different types of apples and compare their characteristics. Learners taste several...
Curated OER
Cold Enough?
Students read and record temperatures and display the data. They represent the temperatures on an appropriate graph and explain completely what was done and why it was done. Students display the data showing differences in the daily...
Curated OER
The Dentist
Students read a short story about visiting a dentist. Then they use toothbrushes in order to demonstrate the correct way to brush teeth. Students use the internet to investigate how some foods are healthier for teeth than others. Then...
Curated OER
Paws in Jobland: Lesson Plan 35 - Catch of the Day
Students study information for fish farm workers given in the form of a chart, in order to practice interpreting data while learning about the career of a fisherman. For this data interpretation lesson, students read the chart to find...
Curated OER
You Are What You Eat (High School)
Learners evaluate data from a statistical chart or graph which they find in a newspaper or magazine.
Curated OER
What's Your Favorite Planet?
Fourth graders interpret a graph and make correlations using data. After taking a class survey, 4th graders create a class graph of their favorite planets. Working in small groups, they interpret the information and create at least ten...
Curated OER
Stretch to the Math Tables
Students count by multiples while performing stretches or exercises. They listen to music and skip count by a given multiple. The rhythm of the music as well as the repitition assists them in their memorization of multiplication facts.
Curated OER
Education for Global Peace
Fifth graders construct data graphs based upon sets of data. In this graphing lesson, 5th graders read the text If the World Were a Village and discuss how types of graphs accurately represent a large population. Students construct their...
Curated OER
Multiplication: Building Models, Representations and Explanations
First graders explore multiplication concepts through skip counting, repeated addition and arrays. Using animal characteristics as a context, 1st graders solve problems using mathematical tools such as hundreds charts, number lines, ...


