Curated OER
Graphing Favorite Fruit
Third graders take poll and sort data, enter the data to create a spreadsheet and create bar and pie graphs.
Curated OER
Graphing
Students investigate graphing. In this bar graph lesson, students view an informational website about graphing, then construct a class birthday bar graph outside with sidewalk chalk. Students choose a survey topic, then collect...
Curated OER
Tables, Charts and Graphs
Students examine a science journal to develop an understanding of graphs in science. In this data analysis lesson, students read an article from the Natural Inquirer and discuss the meaning of the included graph. Students...
Curated OER
Hopes and Dreams: A Spreadsheet Lesson Using Excel
Fourth graders read "The Far Away Drawer" by Harriet Diller and discuss the story as a class. After discussion, 4th graders create a t-shirt GLYPH about their hopes and dreams,share their information with the class and create spreadsheets.
Curated OER
Twelve Days of Christmas--Prediction, Estimation, Addition, Table and Chart
Scholars explore graphing. They will listen to and sing "The Twelve Days of Christmas" and estimate how many gifts were mentioned in the song. Then complete a data chart representing each gift given in the song. They also construct...
Curated OER
Reading Graphs
Students read graphs and charts to interpret results. In this algebra lesson, students interpret bar, line and pictographs. They draw conclusions and make predicitons based on these charts.
Curated OER
What's the Weather?
Second graders make daily weather observations, record them with appropriate stickers on a chart, and then summarize them at the end of the week in the form of a bar graph.
Curated OER
Wheat Kernels Bar Graph
Third graders create a bar graph to record how many kernels were in a wheat stalk. They write in math journals two questions from interpreting the graph. They solve math problems from other students.
Curated OER
Plotting Data on a Graph
Students investigate graphing. In this graphing lesson, students survey the class and create graphs to reflect the data collected.
Curated OER
Graphing
Students gather statistical information on a chosen topic and place it into a spreadsheet. Using th Excel chart wizard, students create tables, graphs and charts of their information. They interpret the data and share it with the class.
Curated OER
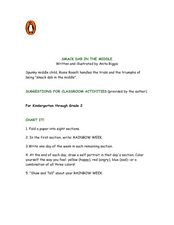
Smack Dab in the Middle
Young scholars read the story Smack Dab in the Middle and complete activities such as charting, writing, illustrating, graphing, and more. In this Smack Dab in the Middle lesson plan, students also discuss the book and retell the story.
Curated OER
Cause and Effect
Third graders investigate cause and effect. In this cause and effect lesson, 3rd graders read a story and determine what are the causes and effects. Students match sentence strips to the make the correct cause and effect sentence....
Curated OER
There's a World of Science to Read Today!
Pupils read a current science article. They write a summary of the article, take notes, write and edit a summary, and print their work.
Curated OER
The Numbers Tell the Story
Students demonstrate how to gather and interpret statistical data. In this data analysis lesson, students search for statistics on the health effects of smoking and place the information into charts. Students create these charts online...
Curated OER
Applied Science - Science and Math Lab
Learners make a prediction. In this applied science lesson, students guess the number of items in a jar. Learners create a bar graph to show the predictions and the actual amounts.
Curated OER
The Mind-Body Connection
Second graders learn about the human body. In this biology lesson plan, 2nd graders will begin with the basics of understanding charts and graphs and progress into units that cover the body systems, and mental and emotional health....
Curated OER
Where Am I: How to Read a Map
Third graders develop an understanding of maps. They explore what a map is, who uses maps, and how to use maps. Students investigate the compas rose. They create a compose rose which illustrates the cardinal directions. Students practice...
Curated OER
Using Data Analysis to Review Linear Functions
Using either data provided or data that has been collected, young mathematicians graph linear functions to best fit their scatterplot. They also analyze their data and make predicitons based on the data. This lesson is intended as a...
Curated OER
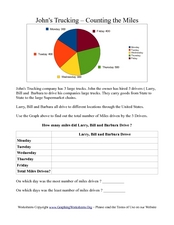
John's Trucking- Counting the Miles
For this graphs worksheet, students analyze a pie graph showing miles driven by three truck drivers in a week. Students fill out a chart in which they calculate total miles driven.
Curated OER
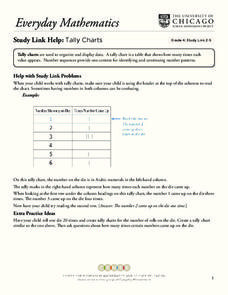
Tally Charts
For this tally charts worksheet, students discuss how to use a tally chart and how to read the chart. Once students record information on a tally chart they answer questions showing their ability to read a tally chart.
Curated OER
Chart problems involving car defects and customer service departments
In this interactive activity, students solve two problems using the charts provided. Students must convey they are able to understand charts and how to read them.
Curated OER
Types of Data
In this data chart instructional activity, students read the directions and study the examples to learn the difference between qualitative, quantitative, discrete and continuous data. Students answer 24 questions. This page is intended...
Curated OER
Country Locations
First graders read a story and locate where the countries in the story are located. In this traditions lesson, 1st graders explore food dishes from different countries and discuss where they are located. Students tell their favorite...
Mathematics Vision Project
Module 2: Systems of Equations and Inequalities
The brother-sister pair Carlos and Clarita need your class's help in developing their new pet sitting business. Through a variety of scenarios and concerns presented to the siblings, the learners thoroughly explore systems of equations...


