Florida Center for Reading Research
Fluency: Words, Speedy Rime Words
Learners time each other as they read as many rime words as possible.
Shmoop
ELA.CCSS.ELA-Literacy.RI.11-12.7
Comparing information found in images, charts, and graphs with that found in written text can be a challenge for even senior high scholars. Provide learners with an opportunity to practice this skill with an exercise that asks them to...
Florida Center for Reading Research
Comprehension: Expository Text Structure, Text Feature Find
Scholars explore an expository text to answer questions about its structure.
Curated OER
A Research Project and Article For the Natural Inquirer
Get your class to use the scientific process to solve a scientific problem. They utilize the Natural Inquirer magazine to identify a research question which they write an introduction to and collect data to answer. They use graphs,...
Curated OER
James and the Giant Peach Plot Analysis
It's all about the plot, main events, and story mapping with this lesson. As the class reads the novel James and the Giant Peach, they create an excitement graph that actually charts key events and moments of excitement. After...
Prestwick House
Catcher in the Rye Activity Pack
The Catcher in the Rye is the focus of a sampler that models some of activities included in a for-purchase packet based on J. D. Salinger's novel.
US Institute of Peace
Simulation on the Israeli-Palestinian Conflict
Why do Israel and Palestine have a history of conflict? Learners find out by participating in a simulation. They work through a scenario and take on one of 27–30 roles. They put themselves in the shoes of people from Israel, Palestine,...
Spartan Guides
Infographics Lesson
An infographic is fantastic way for learners to illustrate their understanding of content, express themselves creatively, and teach others in a manner that is both engaging and informative. While originally designed for a lesson on...
Curated OER
Convergence with The Cay: Exploring Geographic Concepts Wrapped in a Story
Here's an awesome unit that uses The Cay as the anchor text. The 16-page packet is loaded with teaching ideas, activities, and suggested adjustments.
Shmoop
ELA.CCSS.ELA-Literacy.SL.9-10.2
What are diverse media formats? Have your class figure this out on their own through small-group brainstorming. The resource includes two related activities about different kinds of data that will help your class get a grasp of media...
Curated OER
"The Soil Around Us" Project
Young scholars explore how to storyboard. They examine the tasks and roles involved in creating a multimedia presentation. They create a list of quality attributes for the presentation. Use the list to improve the style, accuracy and...
Texas Education Agency
Texas Gateway: Analyze Graphical Sources: Practice 2 (English I Reading)
You will look at each of these types of graphs: bar graph, line graph, pie charts, as you work your way through the lesson.
Read Works
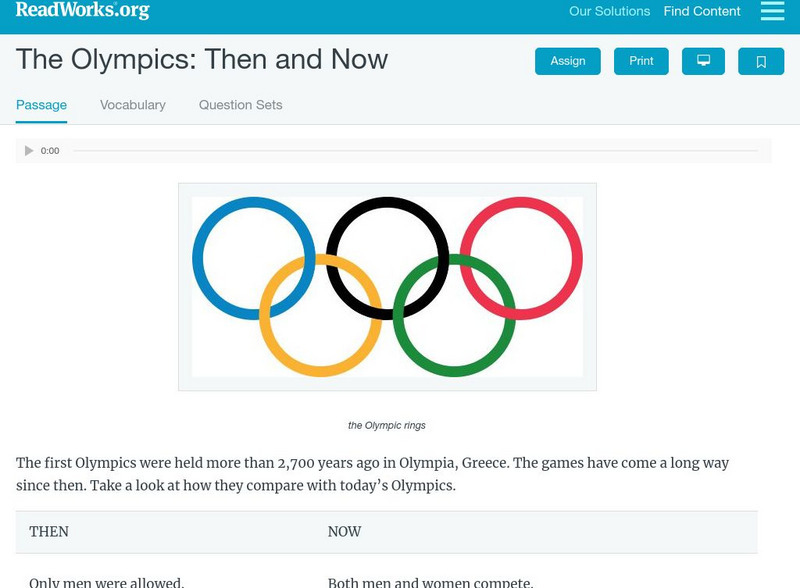
Read Works: The Olympics Then and Now
[Free Registration/Login Required] Students read two charts with information about the Olympics in ancient Greece and in modern times. A question sheet is available to help students build skills in comparing and contrasting.
Read Works
Read Works:north America:comparing Data From Different Countries Around the World
[Free Registration/Login Required] A chart with land and population data from Canada, the United States of America, the United Kingdom, and Japan. A question sheet is available to help students build skills in reading comprehension.
National Center for Ecological Analysis and Synthesis, University of California Santa Barbara
Ucsb / Pie Graphs (Piece of Cake)
This page gives an example and easy-to-understand description of a pie graph (circle graph.) Also provides an opportunity for students to test their abilities to read a pie graph.
Read Works
Read Works: The Middle Ages Feudalism in the Middle Ages
[Free Registration/Login Required] An informational text about feudalism and how it provided stability during the Middle Ages. A question sheet is available to help students build skills in reading comprehension.
Primary Resources
Primary Resources: Line Graphs and Pie Charts
Here are a few resources to use with your students when teaching about line graphs or pie charts.
Read Works
Read Works: Animal Ears
[Free Registration/Login Required] An informational text about four animals that have very different types of ears. A question sheet is available to help students build skills in reading comprehension.
Read Works
Read Works: Ride of the Century
[Free Registration/Login Required] Students read about the 100th birthday of New York City's subway system. A question sheet is available to help students build skills in classifying and categorizing.
The Math League
The Math League: Using Data and Statistics: Pie Charts
This introductory tutorial about statistical graphing with four examples of how pie charts (circle graphs) are constructed and read.
English Zone
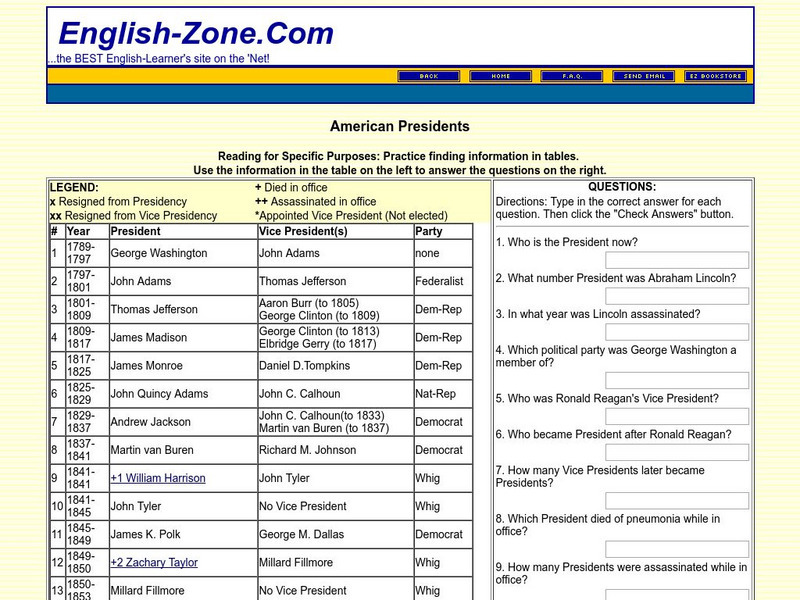
English Zone: American Presidents: Reading for a Specific Purpose
In this activity, information about American presidents is provided in chart format on the left and asks students to use the chart to answer the questions on the right. Note: the last president listed is George W. Bush. Java is required.
Scholastic
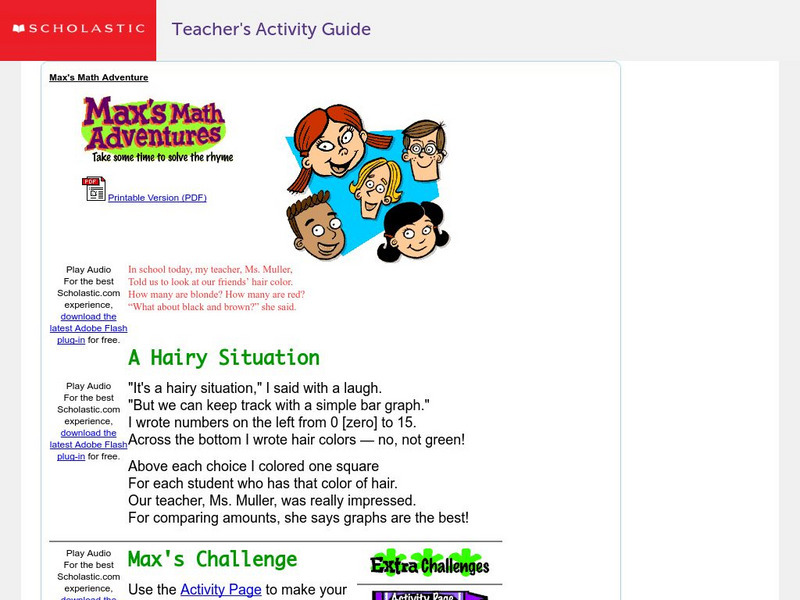
Scholastic: Max's Math Adventures: A Hairy Situation
Help Max make a bar graph to show the hair colors of his classmates. Teachers will appreciate the activities with bar graphs in the extra challenges. Use the teacher's guide to create a fun and engaging lesson.


