TESCCC
Place Value to 999,999
Master place value with a series of lessons that use math journals, manipulatives, and place value mats. Kids follow the instructions to represent numbers of all sizes with base ten blocks and recording sheets.
Curated OER
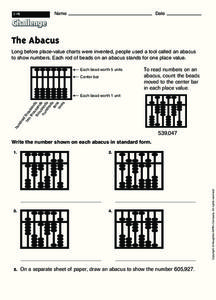
The Abacus
The class reads an explanation of the how the ancient calculation tool, the abacus, works. They examine four abacus images and record the number shown on each of them.
Discovery Education
Discovering Math: Beginning Measurement
Weight, time, length, cost, and mass are all things we can measure. Learners are introduced to the concepts they'll need to know before embarking on any measurement adventure. They are introduced to each type of measurement and types of...
San Jose Unified School District
Multiplication Chart
Looking to support your young mathematicians with mastering their multiplication facts? Then this set of multiplication charts is a great place to start, allowing children to visualize the the relationships between factors and multiples.
Curated OER
Reading Charts and Tables - Garden Spiders
Students complete chart and table reading activities to learn about garden spiders. In this chart and tables lesson, students view a video about garden spider varieties. Students name the different spiders and complete a spider garden...
Curated OER
Pies and Percentages--Learning About Pie Graphs
In this pie graph worksheet, students draw a pie graph for the zookeeper with the data he collected, choose a different color for each animal species and make a key to the graph.
Curated OER
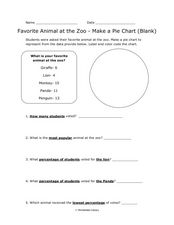
Pie Chart: Favorite Animal at the Zoo
In these three interpreting a pie chart and answering questions worksheets, students use the data provided to label and color code the blank and outlined pie charts, read and interpret a completed pie chart, and then answer questions...
Curated OER
Place Value Charts to the Millions Place
In this math worksheet, students learn to read, write, order and compare numbers and place them on a place value chart. Students begin the 4 pages of exercises by studying a sample place value chart. Students then fill out 3 other charts...
Alabama Learning Exchange
Tiger Math Graphing
Learners practice various skills using the book Tiger Math: Learning to Graph from a Baby Tiger. After listening to the story, they create a pictograph using data collected from the text. They also color a picture of a tiger, collect...
Curated OER
Yummy Math
Young mathematicians use bags of Skittles to help them gain practice in graphing and organizing data. They work in pairs, and after they have counted and organized their Skittles, they access a computer program which allows them to print...
Curated OER
Using Graphs and Charts
Students complete T charts and manipulate numbers using graphs and charts. For this math graphs and charts lesson, students review the concepts of pattern and function. Students then complete practice pages where they manipulate numbers...
Curated OER
A Data Processing Lesson for Statistics -- Reading a Table or Chart
Young scholars identify the structure and key parts of tables and charts. They determine which data is meanjngful and make comparisons with the data. They describe the scope of the AIDS plague throughout the world.
Curated OER
Charts and Graphs
For this charts and graphs worksheet, students refer to charts and graphs to solve word problems. Students complete 10 multiple choice word problems.
Curated OER
Meter Reading Using Place Value
Fourth graders watch a video about reading a gas meter and discuss what they saw in the clip. In this place value lesson, 4th graders complete a worksheet where they fill in the missing dials on the meters.
Curated OER
Table Readings
In this table instructional activity, students read questions and interpret tables. Questions include information concerning unemployment, oil imports, and foreign students. This multiple-choice instructional activity contains 10...
Curated OER
My Test Book: Standard Form and Reading Tables
For this math skills worksheet, learners solve 10 multiple choice math problems that require them to write numbers in standard form and read tables. Students may view the correct answers.
Curated OER
Solving Multi-Step Problems
Use this multi-step problems worksheet to have your charges complete multi-step problems including money, fractions, charts, and more. They complete 30 problems total.
Curated OER
Create a Graph Online
Scholars create colorful bar, line, or pie graphs. They decide on a survey question to ask or a type of data to gather. From there, they collect information and data. They display this data in bar, line, or pie graphs that they create...
Curated OER
Twelve Days of Christmas--Prediction, Estimation, Addition, Table and Chart
Scholars explore graphing. They will listen to and sing "The Twelve Days of Christmas" and estimate how many gifts were mentioned in the song. Then complete a data chart representing each gift given in the song. They also construct...
Primary National Strategy
Ordering and Counting
Are you in need of a 5-day unit intended to teach little learners how to count to 20? This is a well-structured complete set of lessons which employ a variety of methods to instruct learners about various ways to count from 1 to 20. They...
Curated OER
Measures
Estimate and explore the length and weight of classroom items using standard measurement and scales. Students will work in groups to determine appropriate measuring tools, weigh or measure items, and record their results on a data chart....
Curated OER
Lesson 3 How Do You Read Stock Quotes Online ?
Students understand how to get and interpret stock price data online. They describe certain aspects of various corporations and know the meanings of important terms involving the stock market.
Education World
The African American Population in US History
How has the African American population changed over the years? Learners use charts, statistical data, and maps to see how populations in African American communities have changed since the 1860s. Activity modifications are included to...
Alabama Learning Exchange
Yummy Apples!
Young learners listen to a read aloud of Gail Gibbons book, Apples and the story A Red House With No Windows and No Doors. They compare characteristics of a number of kinds of apples, graph them and create a apple print picture. Learners...


