Curated OER
Story Stretching: Tall Tales in North America
Students are introduced to tall tales. In this introductory tall tales unit, students explore the tall tales of Casey Jones and Johnny Appleseed. This unit includes many interdisciplinary lessons including graphing skills and geography.
Curated OER
The Air Up There
In this data collection and analysis lesson, learners observe and graph the weather conditions during one school week, then calculate the average weather temperature. Extensions are included.
Curated OER
Atomic Fractions-III
In this atomic fractions worksheet, students read about electrons and energy levels. Students find all the possible energies that an electron could lose as it jumped from one energy level to another based on a given diagram. They...
Curated OER
Satellite Technology
In this satellite technology learning exercise, students read about Low Earth Orbit satellites and the frictional drag from the Earth's atmosphere that causes them to fall back towards the Earth. Students use given data of the years the...
Curated OER
IBEX Creates an Unusual Image of the Sky!
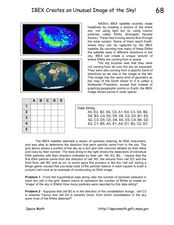
In this IBEX satellite worksheet, learners read about the Energetic Neutral Atoms that are detected by the IBEX satellite. Students use a given hypothetical data string to determine the number of particles detected and create an 'image'...
Curated OER
RIP M&M's
Students solve theoretical probability problems. In this algebra instructional activity, students apply the concept of probabilities to solving real life scenarios. They collect data and graph it using experimental probability.
Curated OER
Involving Community Members, Parents, and Community Agencies in Student Learning
Students predict and estimate the number of moose shot by people between the years of 1986-1990. They analyze data and statistics, construct bar graphs, and conduct research on the Alaskan moose.
Curated OER
Let the Rain Come Down!
Second graders construct a bar graph comparing local precipitation to that of the Yucatan. In this graphing instructional activity, 2nd graders will use conversions and problem solving strategies.
Illustrative Mathematics
High School Graduation
An exercise in finding the approximate time that a name would be called at a graduation. Estimating time may be difficult for some of the class, so this resource would not be a good choice for learning this standard. It does end with a...
Curated OER
The Jellybeans and the Big Dance
Enchant your youngsters by reading them The Jellybeans and the Big Dance, by Laura Numeroff and Nate Evans. Ask them to name objects that begin with the letter J like jellybeans. Give each of them some jellybeans to sort by color....
Curated OER
Creating a Graph
Fifth graders learn information can be organized in different ways to make it easy to read and understand. Students pretend it is their summer vacation and think about their favorite thing to do. After brainstorming, 5th graders survey...
Curated OER
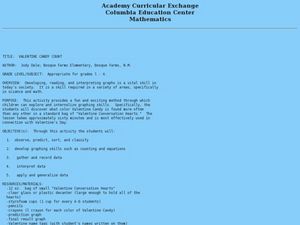
Valentine Candy Count
Students investigate what color Valentine Candy is found more often than any other in a standard bag of "Valentine Conversation Hearts." They sort, classify and graph their findings.
Curated OER
Thiebaud Cake Math: Elementary
Students explore the American artist Wayne Thiebaud. They practice addition, subtraction, fractions, money problems, and classification problems by carefully examining his painting entitled Cakes. They create a bold cake painting.
Curated OER
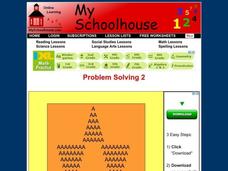
Problem Solving 1
In this online interactive problem solving worksheet, students examine a diagram and use their problem solving skills in order to respond to 5 questions.
Curated OER
The Egg Hunt- Using a Graph to Answer Data Questions
In this pictograph activity, students answer questions based on a pictograph that shows colored Easter eggs. They follow the key that shows that each egg picture is equal to 10 eggs. They fill in the blanks with answers to how many, who...
Mathed Up!
Cumulative Frequency and Box Plots
Learn how to display data. Young data analysts watch a video to review how to create cumulative frequency histograms and box plots. They work on a set of questions to practice producing these data displays.
Curated OER
A World of Information
Students analyze data and statistics about countries around the world. They read graphs and charts, color a world map to illustrate the top ten statistics about the world, and write a paragraph to summarize their information.
The New York Times
Fiction or Nonfiction? Considering the Common Core's Emphasis on Informational Text
Nothing aids in comprehension more than an explanation and understanding of why things are done. Address why the Common Core requires the reading percentages that it established and analyze how this affects your readers. Learners read...
Curated OER
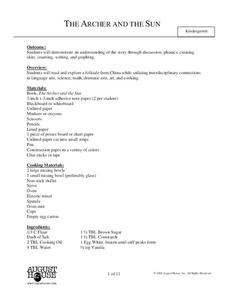
The Archer and the Sun
Students listen to The Archer and the Sun and participate in interdisciplinary activities related to the book. In this Archer and the Sun lesson, students discuss sun and weather and create a graph of the weather they like best- sunny or...
Curated OER
Business Worksheet
In this return on investment practice worksheet, students read about a celebrity's share price over the past week and graph it. This worksheet includes 2 practice problems. One which involves graphing and a second where students explain...
Curated OER
Air Pressure & Barometers
Fourth graders observe, measure, and record data on the basic elements of weather over a period of time (i.e., precipitation, air temperature, wind speed and direction, and air pressure). Then, they make a barometer and keep record of...
Curated OER
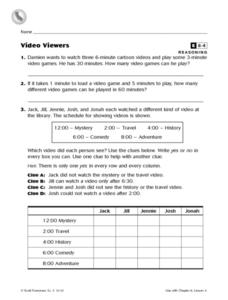
Video Viewers
For this video viewers worksheet, 3rd graders solve 2 word problems dealing with watching videos, read and analyze 4 clues in order to fill in a chart correctly involving 5 people and the types of videos they watch.
Curated OER
Speed, Distance and Time
In this speed and distance worksheet, students calculate the average speed of various items. They determine the speed of cars, trains, worms, and children running. Students also determine the amount traveled in a given period of time....
Curated OER
The 100 Meter Race Problem
In this meter worksheet problem, students read a word problem and interpret a graph. They use the derived information to determine time and distance. This one-page worksheet contains 1 multi-step problem. Answers are...


