Curated OER
What's My Ratio?
Students investigate ratios of various objects. For this ratios of various objects lesson, students draw pictures on graph paper and then dilate or shrink the image. Students determine the ratio of their pictures. ...
Curated OER
Numerical Analysis
In this math worksheet, students practice analyzing root finding algorithms, Newton-Raphson and secant. They use the examples to master the concepts.
Curated OER
Exploring Geometric Figures
Tenth graders explore mathematics by participating in hands-on daily activities. Learners identify a list of different shapes and classify them by shape, size, sides and vertices. They utilize tangrams and geometric pieces to gain...
Curated OER
Coffee: Differential Equation
In this differential worksheet, students read a word problem and write a differential equation and solve it. They draw the slope field for given problems. This two-page worksheet contains 9 multi-step problems.
Curated OER
What's Its Slope
Students identify the slope of a lines.In this algebra lesson, students define the meaning of slope and write an equation given the slope. They graph linear functions using the slope and y-intercept.
EngageNY
Real-World Positive and Negative Numbers and Zero II
Continuing from the previous lesson plan in the series, scholars learn to use positive and negative integers to describe real-world situations. In groups, they come up with their own situations for given positive and negative...
EngageNY
Summarizing a Distribution Using a Box Plot
Place the data in a box. Pupils experiment with placing dividers within a data set and discover a need for a systematic method to group the data. The 14th instructional activity in a series of 22 outlines the procedure for making a...
Redefining Progress
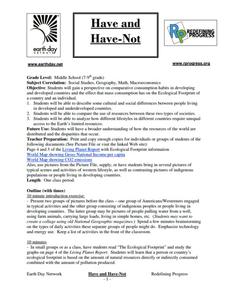
Have and Have-Not
Is there a correlation between a country's wealth and the extent of its ecological footprint? What exactly constitutes an ecological footprint, and how does one country stack up against the rest? This is a unique lesson to incorporate...
Virginia Department of Education
Composition of Functions
Analyze functions by decomposing complex functions and composing simple functions. Through a detailed lesson plan, pupils learn the vocabulary and notation related to the composition of functions. Practice includes both evaluating and...
Lied Center of Kansas
The Ugly Duckling and The Tortoise and the Hare
Both The Ugly Duckling and The Tortoise and the Hare are great additions to an elementary language arts lesson. Young readers focus on the literary elements of each story, including characters and plot development, and apply...
Science Matters
Richter Scale
The 12th instructional activity in a series of 20 opens with a demonstration of exponential functions using pasta. This concept is connected to the Richter Scale, which is also an exponential function. Scholars compare the exponential...
Science Matters
Finding the Epicenter
The epicenter is the point on the ground above the initial point of rupture. The 10th lesson in a series of 20 encourages scholars to learn to triangulate the epicenter of an earthquake based on the arrival times of p waves and s...
Curated OER
What's Your Favorite Planet?
Fourth graders interpret a graph and make correlations using data. After taking a class survey, 4th graders create a class graph of their favorite planets. Working in small groups, they interpret the information and create at least ten...
Curated OER
Daily Upkeep 1
In this math review worksheet, 4th graders read a graph and identify the amount of money earned during a specific week. Then they solve a word problem using multiplication or addition. Finally, students identify which angle shown is best...
Curated OER
Analyze and Interpret Statistical Information
In this probability and statistics worksheet, 9th graders analyze and interpret histograms as they identify trends in the data. The two page worksheet contains four problems. Answers are provided.
Curated OER
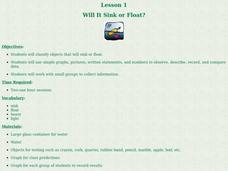
Will It Sink or Float?
Learners perform experiments to see if items will sink or float. For this sink or float lesson, students work in groups to make predictions, and record the results. After the experiments are complete learners make a book of the results.
Curated OER
Using a Pictograph
In this problem solving learning exercise, 5th graders answer four questions using the pictograph provided. The learning exercise pertains to sports.
Curated OER
One, Two, Three...and They're Off
Students make origami frogs to race. After the race they measure the distance raced, collect the data, enter it into a chart. They then find the mean, median, and mode of the data. Next, students enter this data into Excel at which time...
Curated OER
Mathematics Lesson Plan
Second graders study subtraction facts. In this mathematics lesson plan, 2nd graders discuss how to solve two digit subtraction problems. Students recognize that there are many different methods or strategies one can use such as using...
Curated OER
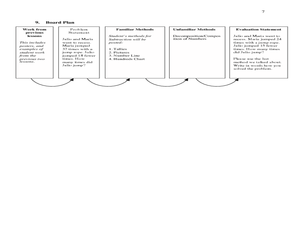
Model and Solve Algebraic Equations
Examine multiple ways to solve algebraic equations. Pupils will generate a problem solving strategy that addresses the prompt given by the teacher. They will then share their problem solving strategy with the class. Graphic organizers,...
Pennsylvania Department of Education
Freckle Face
Students collect and record data. In this early data analysis lesson, students gather data about their partners face. As a class, the students use tally marks and pictographs to record the data and answer question about the information...
Curated OER
Book: Latinos Today: Facts and Figures
Students, after reading Chapter 1 in the book, "Latinos Today: Facts and Figures," identify and characterize the four main ethnic/racial groups in America. They calculate and design a bar graph showing their populations by their...
Curated OER
Effects of Parameter Changes
Students define properties of a quadratic equation. In this algebra lesson, students graph and factor quadratic functions. They write equations for polynomials, given a graph.
Curated OER
Mathematical Magazines
Students classify and tabulate the type of advertisements found in a collection of magazines. Determination is made on what percent of the total number of ads each type represents. They present their results orally and in a graph.


