Royal Baloo
Star Wars K-2nd Math Pack
Included in a Star Wars themed packet, young padawans enhance mathematical skills such as graphing, computing using basic operations, counting numbers and money, telling time, and measuring. Scholars play a game of sudoku, read...
Curated OER
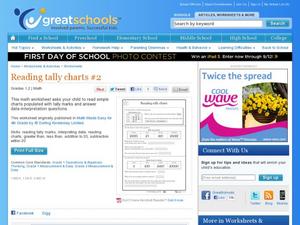
Reading Tally Charts #2
Keep count with tally marks! First graders practice reading tally marks with this straightforward learning exercise. They work with interpreting data from a chart, as well as working with addition and subtraction under 20. A great math...
Curated OER
Math: Navigating the World Around Me
Young mathematicians research and discuss real world math word problems and ways in which they apply math concepts in their everyday lives. They create a storyboard of a math word problem from which they create a slide for a multi-media...
Curated OER
Sunshine Math 3
In this word problems worksheet, learners read and problem solve nine mathematical word problems involving grids, measurement, compensation and angles.
Curated OER
Read and Write Numbers up to 100,000
Use this lengthy, and challenging, presentation in your lesson on numeracy. Pupils practice their skills in reading and writing numbers up to 100,000, interpret a variety of graphs, solve word problems, and get to use a calculator. A...
Common Core Sheets
Determining Coordinates: Reading Positive & Negative Coordinates
For kids who have a hard time with graphing, a grid with coordinates can look like an unsolvable puzzle. A series of worksheets uses symbols and shapes like hearts, stars, and letters to help kids find the correct coordinates.
Curated OER
Double Bar Graphs - Homework 7.1
Your learners have seen basic bar graphs, but do they have experience reading double bar graphs? This worksheet details how to draw a double bar graph and provides an example with six accompanying questions. The final question asks...
Curated OER
Impossible Graphs
Young scholars practice plotting functions on the Cartesian coordinate plane while participating in a discussion about the Possible Or Not worksheet/activity. Students also use the Impossible Graphs worksheet to practice reading a graph,...
Curated OER
Quiz: Reading and Making Line Plots
In this reading and making line plots worksheet, students create a line plot for given sets of numbers. In addition, they read graphs and interpret the average. This one-page worksheet contains ten problems.
Curated OER
Drive the Data Derby
Three days of race car design and driving through the classroom while guessing probability could be a third graders dream. Learn to record car speed, distances traveled, and statistics by using calculation ranges using the mean, median,...
Curated OER
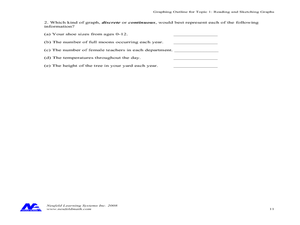
Reading and Sketching Graphs
For this graphs worksheet, learners answer 15 multistep questions about graphs. Students determine distance traveled, time, velocity, and create scenarios to fit the graph.
Curated OER
Reading Graphs with a Logarithmic Scale
Guide high school meteorologists through a detailed examination of oxygen concentration data. The learners analyze a line graph containing logarithmic data and employ the use of a graphing calculator. A comprehensive worksheet and links...
Curated OER
Use a Graph Practice 4.8
What do you like to do after school? Study this bar graph and have learners answer the five questions that follow. Consider asking learners to draw their own bar graph for number five (even though the question can be answered without...
Curated OER
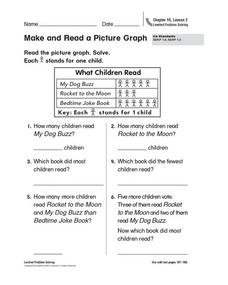
Make and Read a Picture Graph
What books do you like? Have your learners read and interpret a picture graph detailing a fictional class's favorite books. Consider conducting a survey of your learners' favorite books and plotting the results as a class!
Curated OER
Graphs: Number of Cans Collected
Who collected the most recyclables? Learners read the vertical bar graph and answer the eight questions that follow. Review the terms fewer and combined before sending your class on its way.
Mathed Up!
Conversion Graphs
After watching a video on conversions, learners convert meters to feet, dollars to pounds, pounds to Euros, gallons to liters, and kilometers to miles. Then, they graph the conversion changes onto graph templates.
Curated OER
Jelly Bean Math Activities
Using jelly beans as math manipulatives can be a tasty way to introduce and reinforce math concepts. Regardless of the time of year, candy can be used to excite learners and facilitate a wide variety of mathematical concepts.
Teacher's Corner
Brandon's Baseball Collection
Ten questions make up a activity that challenges baseball enthusiasts to read a graph then answer questions pertaining to the data's range, mean, median, and mode.
Curated OER
Reading the Neighborhood
First graders complete activities with the story One Monday Morning in the Macmillan/McGraw Hill Textbook. In this data lesson, 1st graders read the story and gather data to create a picture graph. They read the graph and answer...
Mathed Up!
Transformation of Graphs
In what ways can you transform a graph? An engaging video answers this question as it covers reflections, translations, and stretches of graphs. To test their knowledge, individuals complete a set of problems to apply this knowledge.
Curated OER
Create a Graph Online
Scholars create colorful bar, line, or pie graphs. They decide on a survey question to ask or a type of data to gather. From there, they collect information and data. They display this data in bar, line, or pie graphs that they create...
Curated OER
Graphing
Fifth graders practice using math graphs. In this graphing lesson, 5th graders work in groups to develop a topic of their own to represent as a graph. Students collect data and construct a graph for the lesson.
Curated OER
Problem-Solving Application: Use a Graph: Problem Solving
In this graph usage instructional activity, students read the word problem and then learn to use a math graph by following the steps of understand, plan, solve, and look back.
Inside Mathematics
Sorting Functions
Graph A goes with equation C, but table B. The short assessment task requires class members to match graphs with their corresponding tables, equations, and verbalized rules. Pupils then provide explanations on the process they used to...
