Curated OER
The Hudson's Ups and Downs-Hudson River Activity
In this Hudson River activity, students read a short passage about the river, compare graphs of water levels at different locations, label high and low tides on a graph and interpret, and answer comprehension questions based on several...
Curated OER
U.S. Beach Attendance
In this bar graphs instructional activity, students analyze the information about beach attendance over a period of 5 years. Students solve 3 story problems about the graph.
Curated OER
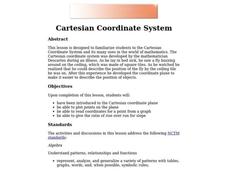
Cartesian Coordinate System
Students explore the Cartesian coordinate plane and plot points on the graph. They interpret coordinates for a point from the graph and give the ratio of rise over run for slope.
Curated OER
Algebra 2 - Linear Programming
Students read real world problems, determine the variables, and set up the function using algebraic statements. After entering data into the graphing calculator, they display information in the form of graphs and scatter plots. ...
Curated OER
Logarithms
In this logarithm worksheet, students read given statements about logarithms and determine if the statement is true or false. This one-page worksheet contains approximately 35 problems.
Curated OER
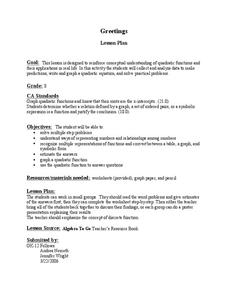
Quadratic Equations and Functions
Young scholars factor and solve quadratic equations. In this algebra lesson, students identify the domain and range of the quadratic function. They graph the parabola and identify the vertex.
Curated OER
Force and Gliders
Young scholars explore physics by creating data graphs in class. In this flight properties lesson, students read the book Flying Machine and identify the force, resistance and construction necessary to keep a glider in the air. Young...
Curated OER
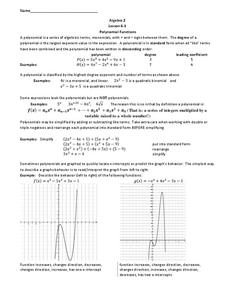
Polynomial Functions
In this Algebra II activity, 11th graders classify polynomials by degree, write in standard form, and describe the behavior of the graph. The two page activity provides explanation and examples along with thirteen practice problems....
Curated OER
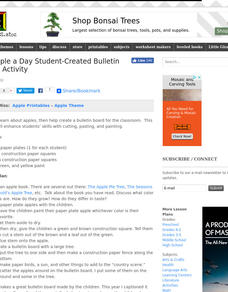
An Apple a Day
Students study apples and then paint apples whichever color is their favorite apple color. They help create a bulletin board for the classroom. They graph the different colors of apples found on the board.
Curated OER
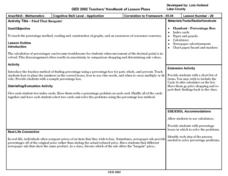
Find That Bargain!
Students explore the methods of calculating percentages, reading and the construction of graphs, and an awareness of consumer concerns in this lesson. The movement of the decimal point often results in uncertainty and confusion. This...
Curated OER
System of Two Quadratic Inequalities
Students graph a quadratic inequality and describe its solution set. They solve a system of quadratic equalities graphically and symbolically and as related to a real-world context.
Curated OER
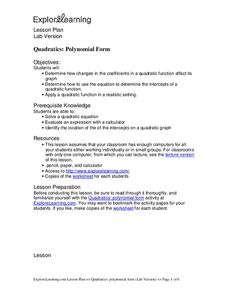
Quadratics: Polynomial Form
Students determine how changes in the coefficients in a quadratic function affect its graph. They Solve a quadratic equations. Students Determine how to use the equation to determine the intercepts of a quadratic function. They...
Curated OER
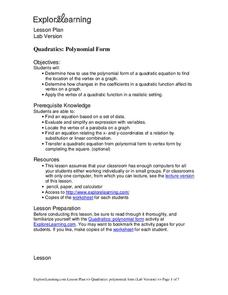
Quadratics: Polynomial Form
Pupils determine how to use the polynomial form of a quadratic equation to find the location of the vertex on a graph. They determine how changes in the coefficients in a quadratic function affect its vertex on a graph. Students find...
Curated OER
High School Examination: Algebra 2/Trigonometry
In this high school worksheet, students solve problems involving angles, functions, square roots, and sequences. They read word problems, write equations, and then solve them. This 28-page worksheet contains 39 problems.
Curated OER
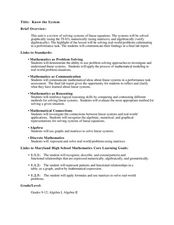
Know the System
Students identify the different systems of equations. In this algebra lesson, students solve systems of equations using graphing, elimination and substitution. They use the Ti to graph their systems.
Curated OER
Relating Distance and Velocity Over Time
Students calculate the distance and velocity over time. In this algebra lesson, students graph a linear function to represent the distance vers time travel. They interpret their graphs and draw conclusion.


