NASA
Nasa: Precipitation Towers: Modeling Weather Data
This lesson uses stacking cubes as a way to graph precipitation data, comparing the precipitation averages and seasonal patterns for several locations. Variations on the lesson can accommodate various ages and ability levels. Students...
PBS
Pbs Kids Afterschool Adventure!: Operation: Martha's Stem Stories Activity Plan
Welcome to Martha's STEM Stories! STEM stands for science, technology, engineering, and mathematics. You may already know that doing STEM means testing ideas, collecting data, making calculations, and drawing graphs and charts-but you...
Other
Visible Geology: Stereonet
A lower hemisphere graph for the placement of geological data is called a stereonet. This site allows students to plot data on their own stereonet(s).
EL Education
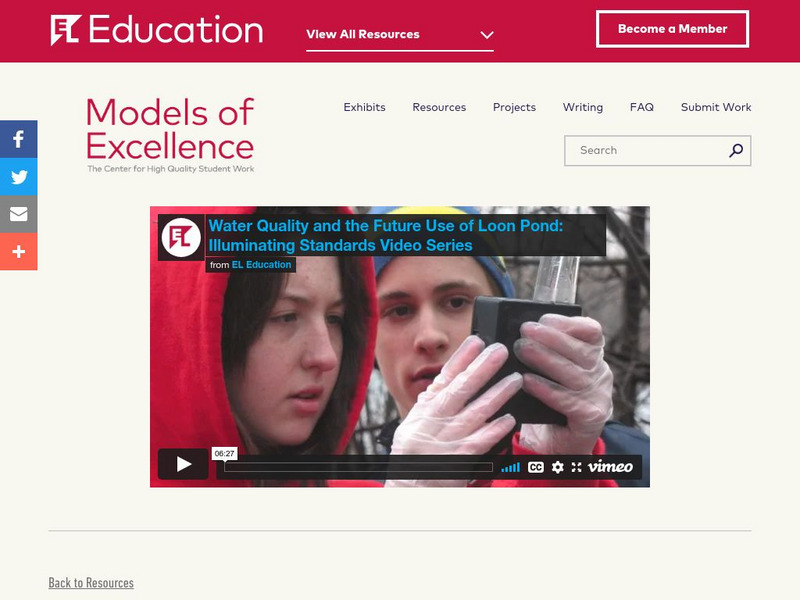
El Education: "Water Quality and Future Use of Loon Pond"
An online research report entitled "2007 Report on Water Quality and Future Use of Loon Pond" by ninth grade students from Renaissance Charter School in Springfield, Massachusetts. Students completed field work testing water and applied...

