Curated OER
Murder in the First Degree - The Death of Mr. Spud
Secondary learners investigate exponential functions in a real-world scenario. They collect data on the temperature of a cooling baked potato, enter the data into lists, and graph the data using a scatter plot before finding an...
Curated OER
How Dense is Salt Water?
Young schoolers explore the concept of linear regression. They determine the mass and density of salt water. Pupils add salt to water and record the density as salinity increases, and perform a linear regression on the data to model the...
Curated OER
Environmental Agents of Mathematics: Mathematics for Change
High schoolers analyze environmental science data using Math. They do research about renewable energy, gather data, create graphs and interpret their findings. Then the group presents their arguments persuasively using their findings to...
Kenan Fellows
Climate Change Impacts
Turn up the heat! Young mathematicians develop models to represent different climates and collect temperature data. They analyze the data with regression and residual applications. Using that information, they make conclusions about...
Texas Instruments
TI-Nspire™ CAS
When it comes to rating educational calculators, this calculator is always near the top of this list. Now it's available as an app. There is a lot of calculator power wrapped up in this app. Not only is this a fully functioning...
Texas Instruments
TI-Nspire™
We landed on the moon with less computing capabilities than you can find in this app! Here is a multiple function calculator that takes all the power you get from a handheld and adds the wonderful large screen that only a tablet can...
Curated OER
Can You Carry a Tune in a Bucket?
Students use water filled pipes to play a tune and consider the mathematics behind the sound waves. In this sound wave lesson, students play a tune with water filled pipes. They create a mathematical model to evaluate the wavelengths and...
Kenan Fellows
Density
Most scholars associate density with floating, but how do scientists determine the exact density of an unknown liquid? The third lesson in a seven-part series challenges scholars to find the mass and volume of two unknown liquids. Each...
Kenan Fellows
Reading Airline Maintenance Graphs
Airline mechanics must be precise, or the consequences could be deadly. Their target ranges alter with changes in temperature and pressure. When preparing an airplane for flight, you must read a maintenance graph. The second lesson of...
Curated OER
High and Low Tides
Students collect real world data from the Web regarding high and low tides at various locations in the United States. They find a function which models this data and make predictions on tide levels based on the information found.
Curated OER
Graphing Data from the Chemistry Laboratory
Students graph and analyze data using a spreadsheet.
Curated OER
Circuits
Students draw a schematic diagram of parts needed to build an op-amp. For this physics lesson, students test the operation of their machine. They graph and analyze data using excel.
Texas Instruments
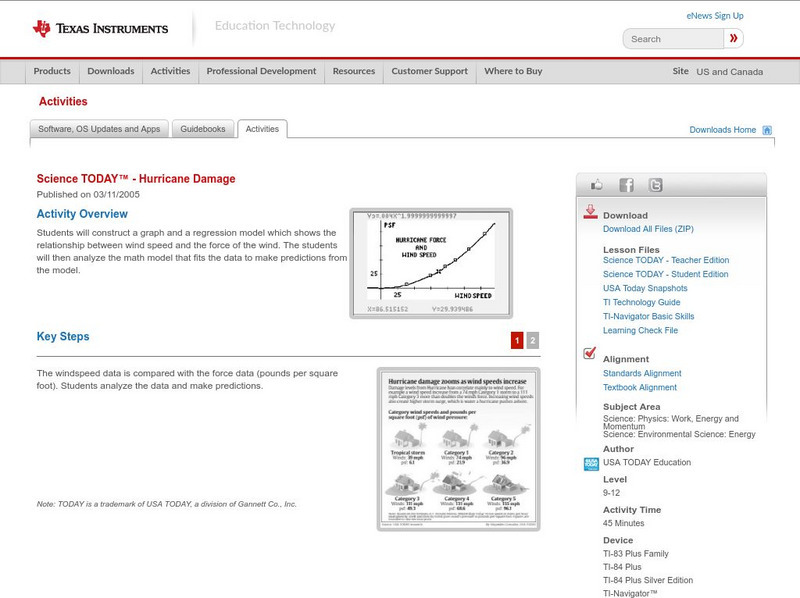
Texas Instruments: Science Today Hurricane Damage
Students will construct a graph and a regression model which shows the relationship between wind speed and the force of the wind. The students will analyze the math model that fits the data to make predictions from the model.
Texas Instruments
Texas Instruments: Growing Babies
In this activity, students observe and graph data about human fetal growth rates. Students build a regression model based on the data and compare values with those of other mammals. They also compare the data to non-mammal species.
Texas Instruments
Texas Instruments: The River of Life
In this activity, students compare human body mass with blood volume. They graph the data and build a regression model. They estimate their own blood volume and also predict volumes of blood for other animals.
TeachEngineering
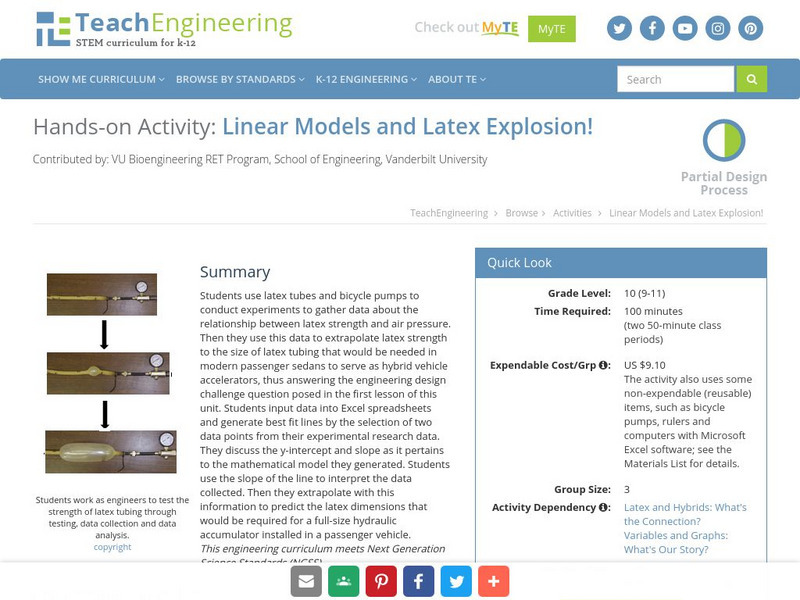
Teach Engineering: Linear Models and Latex Explosion!
Students use latex tubes and bicycle pumps to conduct experiments to gather data about the relationship between latex strength and air pressure.


