Curated OER
Linear and Exponential Models
Learners linearize data to determine if an exponential model is suitable. In this linearizing data to determine if an exponential model is suitable lesson, students graph the residuals of sets of data that appear to have an exponential...
Curated OER
Lesson 6-7: Scatter Plots and Equations of Lines
In this scatter plot worksheet, students examine tables and write a linear equation that matches the table. Students graph linear equations. They read scatter plots, determine the trend line, and write a linear equation to match...
Curated OER
Baseball Relationships - Using Scatter Plots
Students use graphing calculators to create scatter plots of given baseball data. They also determine percentages and ratios, slope, y-intercepts, etc. all using baseball data and statistics.
Curated OER
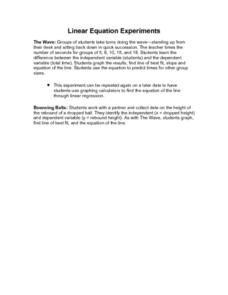
Linear Equation Experiments
In this linear equation activity, students solve and complete 2 different experiments that include using linear equations. First, they determine the difference between independent and dependent variables. Then, students graph their...
Kenan Fellows
Climate Change Impacts
Turn up the heat! Young mathematicians develop models to represent different climates and collect temperature data. They analyze the data with regression and residual applications. Using that information, they make conclusions about...
Curated OER
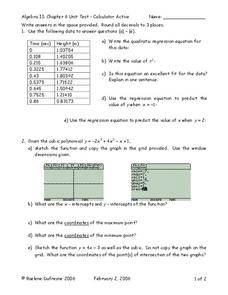
Polynomial Functions
In this Algebra II worksheet, 11th graders use a graphing calculator to determine the regression equation of the given data, graph polynomial functions, factor polynomials, and determine the quotient and remainder in polynomial division....
Curated OER
Scatterplots
In this scatterplots worksheet, students construct a scatter plot from a given data set. Students then answer 4 questions regarding the least-squares regression line and making predictions.
Curated OER
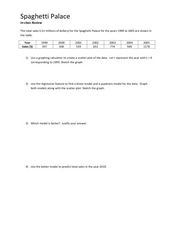
Spaghetti Palace
In this spaghetti palace worksheet sheet, learners examine data and create a scatter plot. They use their graphing calculator to find a linear model and a quadratic model for given information. Students predict total sales. This...
Curated OER
Making Predictions from Data with a Graphing Calculator
For this making predictions from data worksheet, high schoolers solve 15 short answer problems. Students determine average miles per gallon given data on miles traveled and gas used. High schoolers make predictions using the data and a...
Curated OER
The Graduation Dilemma
Ninth graders explore data analysis. In this Algebra I lesson, 9th graders collect and organize data to create a scatter plot. Students use the regression feature of the calculator to find the line of best fit and use the equation to...
Curated OER
Line of Best Fit
Students explore the concept of linear regression. In this linear regression lesson, students do a Barbie bungee activity where they collect linear data. Students plot their data using a scatter plot. Students determine a line of best...
Curated OER
Academic Algebra II Test Chapter 4, Part 2
In this test of knowledge worksheet, students answer 2 story problems, they solve 6 systems of equations. Students multiply 2 maxrix sets. They determine the inverse of two matrices. Students determine the linear regression line for two...
Curated OER
Linear and Quadratic Model, Data Modeling
Students model quadratic and linear equations. In this algebra lesson, students solve word problems using equations. They create scatter plots and make predictions using correlations.
Curated OER
Comparison of Univariate and Bivariate Data
Learners explore the concept of univariate and bivariate data. In this univaritate and bivariate data lesson, pupils discuss the differences between univariate and bivariate data. They work sample problems where they must construct box...
Curated OER
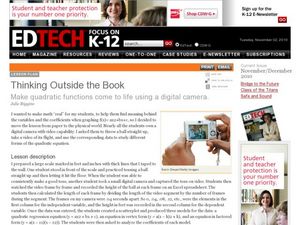
Thinking Outside the Box
Now this lesson sounds fun! Students throw a ball, film it as it soars through the air, and use a spreadsheet to collect data. A scatterplot is created to produce a quadratic regression equation, an equation in vertex form, and an...
Radford University
Sleep and Teen Obesity: Is there a Correlation?
Does the number of calories you eat affect the total time you sleep? Young mathematicians tackle this question by collecting their own data and making comparisons between others in the class through building scatter plots and regression...
Intel
What Does This Graph Tell You?
What can math say about natural phenomena? The fifth STEM lesson in this project-based learning series asks collaborative groups to choose a phenomenon of interest and design an experiment to simulate the phenomenon. After collecting...
Shodor Education Foundation
Data Flyer
Fit functions to data by using an interactive app. Individuals plot a scatter plot and then fit lines of best fit and regression curves to the data. The use of an app gives learners the opportunity to try out different functions to see...
Radford University
How to Calculate and Analyze the Equation for a Parabolic Path
Working in groups, pupils plot three points on the coordinate plane representing three different parabolic paths. Using a calculator, they determine the quadratic regression equation for their models. Each team then figures out the...
Curated OER
Exploring Circles
Learners explore circles using a graphing calculator. In this circles lesson, students write the equation of a circle with a given center and radius length. Learners find the most appropriate model for each combination of data they...
Curated OER
Business & Statistics: Final Exam
In this business and statistics worksheet, young scholars read real-life business problems, arrange data, and identify the probability method best used to determine the answer. They identify the type of random sample, draw stem-and-leaf...
Curated OER
Inflamm-O-Stories: Progression and Regression of Atherosclerosis
Learners participate in activities to learn about Atherosclerosis. For this investigative lesson students participate in activities that allow them to describe parts of the body, analyze changes in the body and write a story about their...
Curated OER
Linear Regression (and Best Fit)
Students explore notions of relationships between two variables. They use discussion, games, worksheets, spreadsheets to consider relationships such as: height vs. shoe size, cricket chirping vs. temperature.
Curated OER
Thirst Dilemma (Drinking in the Desert)
Ninth graders explore linear functions. In this Algebra I lesson, 9th graders collect and analyze date as they investigate the question of how long will water last if you are trapped in a desert. Students create scatterplots of their...


