Curated OER
Bar Graphs
Seventh graders visually represent and analyze data using a frequency table. They recognize what values in a data set are bigger by looking at a bar graph and answer questions about certain bar graphs and what they represent. Students...
Curated OER
Dough Lake Topology
High schoolers practice coordinates and measurements, develop 2D, 3D topological map, construct grid with string on real surface, establish "level" fixed point for measurements, take and record data points of elevation, and enter data on...
Curated OER
The Human Line Plot
Fifth graders collect data and use charts and line plots to graph data. Through class surveys, 5th graders collect data concerning a particular subject. They graph their data using a line graph. Students make inferences and predictions...
Curated OER
Learning to Make Bar Graphs
Students construct bar graphs using the results from various experiments. In this graphing lesson, students review data from a previous experiment and demonstrate how to construct a bar graph. Students use a checklist to ensure...
Curated OER
Scatterplots
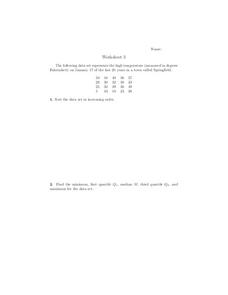
In this scatterplots activity, 9th graders solve and complete 6 different word problems with different sets of data. First, they sort the data set in increasing order and find the minimum, first quartile, median, third quartile, and...
Curated OER
Graphing Data
First graders learn how to display data using a bar graph. In this bar graph lesson, 1st graders use data from a t-shirt color survey to make a bar graph. They also make an animal bar graph before interpreting the information.
Curated OER
Student Heights
Students measure the heights of their fellow classmates and create a box and whisker plot to display the data. In this measurement lesson plan, students analyze the data and record results.
Curated OER
Temperature Bar Graph
Students explore mean, median and mode. In this math instructional activity, students analyze temperature data and figure the mean, median, and mode of the data. Students graph the data in a bar graph.
Curated OER
Local Traffic Survey
Students conduct a traffic survey and interpret their data and use graphs and charts to display their results.
Curated OER
Our Favorites
Students participate in and conduct a survey to determine various class favorites. They collect, organize and display their data, interpret the results, and complete a packet of worksheets to display the information.
Curated OER
Seized Before Flights: Graph
In this bar graph worksheet, students analyze a graph that show the number of prohibited items intercepted at U.S. airport screening checkpoints. Students answer 3 problem solving questions about the data on the graph.
Curated OER
Discovering Pi
Students develop a formula that describes the functional relationship of the circumference of a circle to its diameter. Working with a partner, they measure the diameter and circumference of circular objects in order to discover the...
Curated OER
Jumping to Conclusions
Students decide as a class what their data is going to be to graph. In this math lesson, students organize data so that it will be easier to display in a graph. Students are guided through the process by their teachers, and helped with...
Curated OER
Formation of Rain
Students sequence the steps leading to the formation of rain, and design a model to represent these steps. This task assesses students' abilities to classify, generalize, infer, interpret and communicate data, and construct a pictorial...
Curated OER
Probability Lesson Plan
Your learners will examine probability through experiments and dice games. Using a computer, your class will perform simple experiments to collect and analyze data to determine the probability of different experimental results. Students...
Curated OER
How Much Is Too Much?
Students examine population growth and collect data. In this statistics lesson, students create a scatter plot to represent the different species found in the water and are being harvested. They graph their data and draw conclusion from it.
Curated OER
Permafrost
Learners use a thermometer to analyze soil temperature data to determine which soil sample is normal, and which one is permafrost. In this permafrost lesson plan, students participate in a hands on activity where they identify the active...
Curated OER
Hand Sensitivity
Learners experiment with the sense of touch. In this tactile lesson, students determine the most sensitive area of the hand. Learners experiment by describing objects through touch only. Students compare the amount of sensory data...
Curated OER
Probing Under the Surface
Eighth graders use a measuring stick to determine the shape of the inside of the bottom of a box, then apply their knowledge to an additional situation. This task assesses students' abilities to make simple observations, collect and...
Pennsylvania Department of Education
Use Order of Operations to Evaluate Expressions—No Grouping Symbols
Students identify and explain different types of data collection and graphs. In this graphs and data collection instructional activity, students record their observations of a variety of data collection tools and graphs displayed in the...
Curated OER
Vectors: Follow That Arrow
Vectors and their connection to motion. A video will be presented to provide information for the class to use methods of solving vectors with and without grids. Real-world physical concepts will be explored in reference to vectors.
Curated OER
Data From Interviews
Students create and conduct a survey about favorite foods, gather and represent the data, interpret data and make predictions to present to the class. They create and use interview questions to gather data. Pupils are explained that...
Curated OER
Collecting Data
For this data collection worksheet, students read about how data is collected and organized. They also learn about a hypothesis. Students read through examples of different charts and then answer 23 questions pertaining to data...
Curated OER
Which Bag is Which?
Young scholars explore number sense by completing a statistical analysis game in class. For this data graphing lesson, students utilize visual references such as colored cubes and tiles to map out the results of an experiment outcome...


