Curated OER
Interpreting Graphs
Students investigate graphs. For this graphing lesson, students create a graph regarding the population of California. Students extrapolate answers concerning the data set.
Curated OER
Getting There
Students practice reading a pictograph. In this data analysis lesson, students collect data and create their own pictograph. A students worksheet is included.
Curated OER
Graphing Data
First graders explore the concept of graphing. In this data lesson, 1st graders gather information from a class survey and display their findings on a picture graph. Students also practice solving problems that their instructor models.
Curated OER
Shopping With a Circle Graph
In this shopping with a circle graph worksheet, students use the data in the graph to answer 8 questions about the money they have and how they can spend it.
Curated OER
Investigating Seasonal Variability in NO2 Concentrations
Young scholars study different formats of data and determine the nitrogen dioxide concentrations. In this seasons instructional activity students understand the different relationships that NO2 can have.
PBS
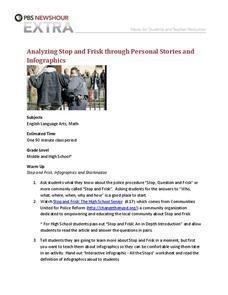
Analyzing Stop and Frisk Through Personal Stories and Infographics
How much can you learn about an important topic from a single image? High schoolers analyze an infographic that represents the number of stops performed during the Stop and Frisk police procedure. After building background information...
Southwestern Medical Center
Field Epidemiology: Investigation of an Unknown Disease
More than 90 percent of the people in a building have come down with an illness, and it is your job to investigate. Teachers give scientists the data needed to decide what is important and how they can solve the mystery....
Curated OER
Glowing Constellations
Students conduct their research to creating an artistic image that shows what their constellation represents. They demonstrate their ability to represent data in their own artistic manner. Afterward, they recognize constellations both...
Math Drills
Trick-Or-Treat Candy Probabilities
Class members satisfy their sweet tooth with a Halloween-themed, candy probability activity. Using images of candy pieces that represent data, young mathematicians find the probability of getting different pieces of candy while...
Curated OER
Data Analysis and Probability Race to the Finish
Students practice addition facts, record data, and construct a bar graph. In this probability lesson, students participate in a board game in which bicycles move towards a finish line based on players completing addition problems. Dice...
Curated OER
Pancakes, Anyone?
First graders explore data collecting and graphing. In this data collecting and graping lesson, 1st graders watch a video about monster who sells pancakes. Students make a graph to record the most popular pancake. Students also play...
Curated OER
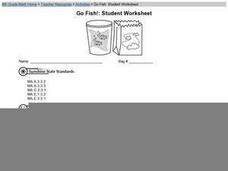
Go Fish! Student Worksheet
A math and science worksheet prompts learners to simulate how scientists determine populations of animals out in the wild. They use goldfish crackers, paper bags, and a styrofoam cup as their tools. An excellent cooperative group activity!
Curated OER
Data Analysis
In this data analysis worksheet, pupils solve and complete 4 different types of problems. First, they reduce the data provided to find the means, and graph the means in a line graph. Then, students graph the data from each mixture shown...
Curated OER
Mapping Data Made Manageable
Learners explore how to select unbiased random samples as they choose report data to include on maps. They propose methods for choosing random numbers and discuss their advantages and disadvantages. They consider bias in science.
Curated OER
The 400-Meters Race
Pupils collect and graph data. In this algebra lesson, students describe, interpret and analyze data. They follow a 400 meters race and plot the coordinates of the course. They graph a line to represent the data of the course.
Curated OER
Mean, Mode, Median
In this mean, mode, and median worksheet, 8th graders solve and complete 6 different problems that include determining the mean, mode and median of various sets of numbers. First, they explain how to determine the median, mode and mean....
Curated OER
Correlating Atmospheric Data Lesson Plan
Students make and test hypotheses about atmospheric data collected aboard the NOAA ship Ronald H. Brown research cruise.
National Museum of Nuclear Science & History
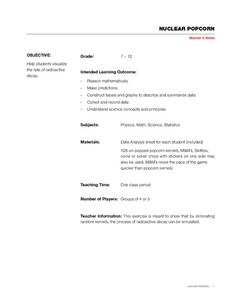
Nuclear Popcorn
Make your lesson on radioactive decay pop with this lab exercise. Using popcorn kernels spread over a tabletop, participants pick up all of those that point toward the back of the room, that is, those that represent decayed atoms. As the...
Balanced Assessment
Survey Says
Examine statistical data that shows an overlap in responses. The data tallies over 100% and learners interpret this data characteristic. They then create a graph to represent the data.
Curated OER
Using Averages
In this math worksheet, students compute the range, mean, median and modal weight of candy bars from two machines. Students write a short essay about which machine is using too much chocolate and which is more reliable.
Curated OER
Froot Loops to the Max - 2
In this Froot Loops to the max worksheet, learners complete and solve 5 problems related to a box of Froot Loops cereal. First, they determine how many of each color is represented in the box of Froot Loops. Then, students determine...
Curated OER
Froot Loops to the Max - 1
Middle schoolers complete and solve five questions related to a box of Froot Loops cereal. First, they determine how many of each color of Froot Loops and which color has the greatest and least frequency. Then, pupils write the fraction...
Curated OER
Asthma Survey
Young scholars collect survey data on the prevalence of asthma in a community. They summarize and display the survey data in ways that show meaning.
Curated OER
Is Global Warming Happening?
Young scholars investigate the probability of global warming and the effects of global warming on the environment. They conduct Internet research and collect data, transfer the data onto an Excel spreadsheet, and create a presentation...


