Curated OER
The Golden Students
Scholars view the video, "Donald Duck in Mathmagic Land," and discuss examples in nature which have proportions of the golden ratio. They measure and record different body lengths from a worksheet and convert the ratios to equivalent...
Balanced Assessment
Dollar Line
Challenge the class to develop a story that matches a graph. The short assessment provides a line graph with the vertical axis labeled as dollars. The task asks pupils to develop a description of a situation that could be represented by...
Alabama Learning Exchange
Yummy Apples!
Young learners listen to a read aloud of Gail Gibbons book, Apples and the story A Red House With No Windows and No Doors. They compare characteristics of a number of kinds of apples, graph them and create a apple print picture. Learners...
University of Colorado
Spacecraft Speed
Space shuttles traveled around Earth at a speed of 17,500 miles per hour, way faster than trains, planes, or automobiles travel! In the 13th installment of 22, groups graph different speeds to show how quickly spacecraft move through...
National Institute of Environmental Health Sciences
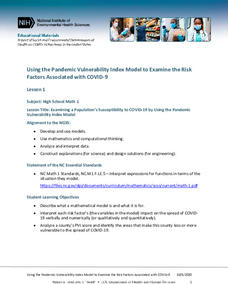
Lesson 1: Using the Pandemic Vulnerability Index Model to Examine the Risk Factors Associated with COVID-19
How vulnerable are you to COVID-19? High school mathematicians use the Pandemic Vulnerability Index to create models that help them collect and analyze data about the risk factors associated with COVID-19. After investigating four groups...
Utah Education Network (UEN)
Linear Relationships: Tables, Equations, and Graphs
Pupils explore the concept of linear relationships. They discuss real-world examples of independent and dependent relationships. In addition, they use tables, graphs, and equations to represent linear relationships. They also use ordered...
Curated OER
Introduction to Functions
Students explore functions, function rules, and data tables. They explore terms of linear functions. Students use computers to analyze the functions. Students write short sentences to explain data tables and simple algebraic expressions.
Curated OER
Graph It with Coffee!
Students interview employers and employees at local coffee shops about sales and profits and create graphs comparing and contrasting information obtained about the businesses.
Curated OER
Plastic Packaging
Students collect data. In this math instructional activity, students collect data about recyclable materials. Students develop a plan that will help the environment. Recycling plastic containers is discussed.
Curated OER
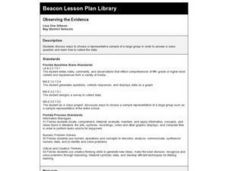
Observing the Evidence
Fifth graders explore how to do research from a large group. They explore how to choose a representative sample and collect data from it.
Curated OER
Graphing Family Reading Habits
Second graders collect data from their families about their reading habits and graph them. In this graphing family reading habits instructional activity, 2nd graders interview family members about their reading habits. They then use a...
Pennsylvania Department of Education
Adding and Subtracting Three-Digit Numbers by Jumping
Second graders use data to graph information and draw conclusions. In this instructional activity on data analysis, 2nd graders practice gathering, sorting, comparing, and graphing data. Students differentiate data that can and cannot...
Curated OER
Go Fish!
Eighth graders use goldfish crackers to simulate a capture-recapture method of data collection. They fill in a chart and determine the averages. They find the estimated population of fish and the actual population of fish based on the...
Curated OER
Entrance Ticket
Students collect data on different events and word problems. In this algebra lesson, students use a table to organize their data. They graph their coordinate pairs on a coordinate plane and make predictions.
Curated OER
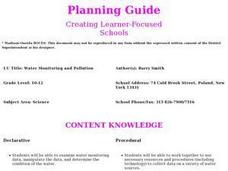
Water Monitoring and Pollution
Students explore the effects of pollution on water supply and how to identify safe drinking water. They test different samples of water over regular intervals and analyze the results to see if they are cyclical or represent a growing...
Biology Corner
Pipe Cleaner Babies
Ever been told you have your father's eyes? How did it happen? Young biologists get a hands-on experience in meiotic gene expression with a fun pairs-based activity. Participants use pipe cleaner chromosomes with trait beads to make...
Curated OER
The New York City Draft Riots: A Role Play
This is a fun, thought-provoking instructional activity. Learners use census data from 1855, primary source documents, their historical knowledge, and information regarding the New York City Draft Riots of 1863 to construct and engage in...
Curated OER
Worksheet 19: Ship Positions
In this math worksheet, students read informational paragraphs and then answer 18 questions using data from their readings. Questions are about vectors, positions, distance and orbits.
Curated OER
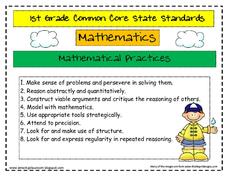
Common Core State Standards 1st Grade Math
Here are the complete set of the math practice standards and the Common Core standards for first grade. They cover operations & algebraic thinking, operations in base 10, measurement and data, and geometry. Illustrated nicely with...
Curated OER
The American Revolution: 1775 - 1783
Track the ins and outs and wartime strategies used by both the British and the Americans during the Revolutionary War. Multiple comparisons are made between both factions, maps, statistical data, images, and light text is used throughout...
Curated OER
Reshaping the Nation
Young scholars learn why the census makes a difference. In this U.S. Census lesson plan, students learn how to read and use a cartogram while they explore new ways to represent data.
Curated OER
What Does Average Look Like?
Fifth graders explore the concepts of range, median, mode, and mean through the use of graphs drawn from models. They use manipulatives to represent data they have collected within their groups, and compare the differences between mode,...
Curated OER
Download and Analyze
Students download information from a NASA website into a database. They transfer it to a spreadsheet by completing the information and analyze the information. They determine temperature averages, mode, and graph the results. They write...
Curated OER
Graphically Speaking
Students discover the links between population and Congressional representation. For this government lesson, students research population statistics and create spreadsheets that compare population to the number of Congress members per...


