Curated OER
Applied Science-Science and Math (2A) Post Lab
Second graders create a graph about TV watching. In this bar graph lesson, 2nd graders make a hypothesis about how much TV 2nd graders watch per week. They record their TV watching for a week and bring it to school to create a class graph.
Curated OER
Pythagorean Theorem
Students solve problems using the Pythagorean Theorem. In this geometry lesson plan, students identify the sides and angles of a right triangle. They find the different trigonometric ratios and solve using sine, cosine and tangent.
Curated OER
Wings and Othe Things
Students work in groups that are engaged in different activities at different times. They watch the video "Madagascar" and collect data pertaining to the Fish Eagle's arm spam. They work together to perform mathematical computations...
Curated OER
Words, Words, Words
Second graders choose estimation strategies in real-world problem situations and explain the choice. They work in groups of five using three different estimation methods to find out how many words are on a page of text.
Curated OER
Over and Under Estimation
First graders distinguish between an over-estimate and an under-estimate. They estimate the number of beans that can be held in a hand, organize data and actual findings.
Curated OER
Measuring Different Surfaces
Fourth graders investigate measurement of linear and curved surfaces. In this math lesson, 4th graders discuss how to measure curved surfaces and work with a partner to measure various curved surfaces.
Curated OER
Using Averages to Create Graphs Through Excel
Sixth graders create and use a spreadsheet to make graphs which will be used to analyze Progress Report and Final Report Card grades. They practice finding the mean, median, mode, and range of a data set. Students also incorporate column...
Curated OER
Buying My First Car
Learners pretend they are about to buy their first new car. They must do all the calculations necessary to estimate the cost of purchasing the car. They see that the math they learn in school really does have real-life applications.
Curated OER
Pythagorean Theorem Investigation
Eighth graders investigate the Pythagorean Theorem and practice applying the theorem to various triangles. Finally, in the next lesson in the sequence, 8th graders create a song or a story to help them remember the Pythagorean Theorem.
Curated OER
Estimation and Pattern Discovery
Learners collect sunflower heads from their community garden. They estimate its seed count using different strategies. They graph their estimations on a graph and use calculators to find the actual total.
Curated OER
Marshmallows
Third graders estimate the volume and mass of one marshmallow using appropriate standard units. They design and carry out an investigation to find the average of volume/mass of one marshmallow.
Curated OER
Easy Estimation
Students use estimation as a math strategy. Students estimate the number of small snacks that are presented to them. Students count the snack items after they have estimated how many there are, before the class snack on a daily basis.
Curated OER
A Statistical Study on the Letters of the Alphabet
Learners use a book or magazine to research the use of letters. They complete a worksheet and compare their results.
Curated OER
A Statistical Study on the Letters of the Alphabet
Students see that there are mathematical rules that can affect our use of the English language. Calculate the probability of picking any letter at random from a piece of English literature.
Curated OER
Graphing the Daily Revenue of Miami Seaquarium
Seventh graders compile a table of the revenues of the 8 eateries (a combined total), Main Gate admissions, and the Gift Shop.
Curated OER
Squirrel Challenge
Students utilize The Nature Park Adventure educational software program to Introduce Modelling, Including the Estimation of Angles.
Curated OER
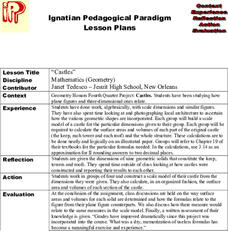
Castles
Students create a scale model to a castle using the dimensions they were given. They calculate the surface areas and volumes of each section of their castle.
Curated OER
Thank You... Thomas Edison!
Students investigate the life of Thomas Edison. They research how he made a difference. They understand that accurate data collection is important for math. They create a chart using spreadsheet data.
Curated OER
Measuring Angles
Third graders describe an amount of turn from a particular position to another using the 'circular' benchmarks of 0, ++, ++, ++, and full turn. Estimation language such as 'just about', 'between', 'not quite', 'just over', and similar...
Curated OER
Abiator's Interactive Mathematics Activities
Young scholars use an internet resource to practice problem solving. They use the Abiator's Interactive Mathematics to complete the problem solving activities provided by the website. In addition, they write down their answers on a piece...
Curated OER
Budgeting 101
Students identify various sources of income and discern between needs and wants as they also learn to create a personal budget. In this personal budget lesson, student understand financial scenarios as they relate to different ways...
Other popular searches
- Math Rounding Numbers
- Rounding Numbers 10 100
- Rounding Numbers Worksheets
- Rounding Numbers Chant
- Rounding Numbers Games
- Teaching Rounding Numbers
- Rounding Numbers Activities
- Rounding Numbers With Money
- Rounding Numbers Anthill
- Math Rounding Numbers
- Rounding Whole Numbers Game
- Rounding Off Numbers Game


