Hi, what do you want to do?
Curated OER
Graph It!
There is more than one way to represent data! Learners explore ways to represent data. They examine stacked graphs, histograms, and line plots. They conduct surveys and use stacked graphs, histograms, or line plots to chart the data they...
Curated OER
Modeling: Having Kittens
Cats can't add, but they do multiply! Determine the number of descendants of a single cat given specific facts about cats and kittens. The lesson focuses on developing strategies for problem solving using both individual and group work....
Statistics Education Web
Consuming Cola
Caffeine affects your heart rate — or does it? Learners study experimental design while conducting their own experiment. They collect heart rate data after drinking a caffeinated beverage, create a box plot, and draw conclusions....
American Statistical Association
Bubble Trouble!
Which fluids make the best bubbles? Pupils experiment with multiple fluids to determine which allows for the largest bubbles before popping. They gather data, analyze it in multiple ways, and answer analysis questions proving they...
EngageNY
Events and Venn Diagrams
Time for statistics and learning to overlap! Learners examine Venn Diagrams as a means to organize data. They then use the diagrams to calculate simple and compound probabilities.
Curated OER
Using Bar Graphs to Understand Voting Patterns
Bar graphs are used as a way to study voting patterns in the United States. A variety of statistical data is presented in the graphs, and pupils must interpret the data in order to make a report to the class. Three excellent graphs,...
American Statistical Association
Step into Statastics
Class members study the size of classmates' feet and perform a statistical analysis of their data. They solve for central tendencies, quartiles, and spread for the entire group as well as subgroups. They then write a conclusion based on...
Curated OER
Go Fish!
Students collect data, interpret data summarize proportional reasoning. Students determine (with various alternate goods) the number of fish in a nearby pond. Students capture the goldfish crackers, deal with pretzels and then write...
Curated OER
Birthday Problem
Young scholars identify the probability of an event occurring. Learners explore the complement of an event in finding why an event will not happen. They also explore basics of probability within algebra.
Curated OER
Lesson 6-7: Scatter Plots and Equations of Lines
In this scatter plot worksheet, students examine tables and write a linear equation that matches the table. Students graph linear equations. They read scatter plots, determine the trend line, and write a linear equation to...
Curated OER
Graph it!
Sixth graders view a Stacked Graph, and discuss what it shows. Students discuss the basics of graphing: labels, intervals, legends x and y axis... Students create individual stacked graphs from provided information. Students view a...
Curated OER
How Big is a Dinosaur?
Fourth graders create enlarged replica of a stegosaurus drawing, using a grid to practice coordinates.
Curated OER
Maps
Students investigate threee types of maps. For this algebra lesson, students idenitfy different maps and explore how they relate to the area keeping cllimate and topography in mind. They discuss maps used to navigate land. air and sea.
Science Buddies
Science Buddies: Estimation and Population Size
Have you ever wanted to take a short cut? How about when doing your math homework? In this experiment you can learn how estimation can save you time doing math calculations. But beware, some estimations are better than others. Can you...
Scholastic
Scholastic: Data Sampling
Data Sampling is a cutting-edge digital program designed to give young scholars multiple opportunities to dig deeply into the mathematics and real-world purposes of representative sampling.
Khan Academy
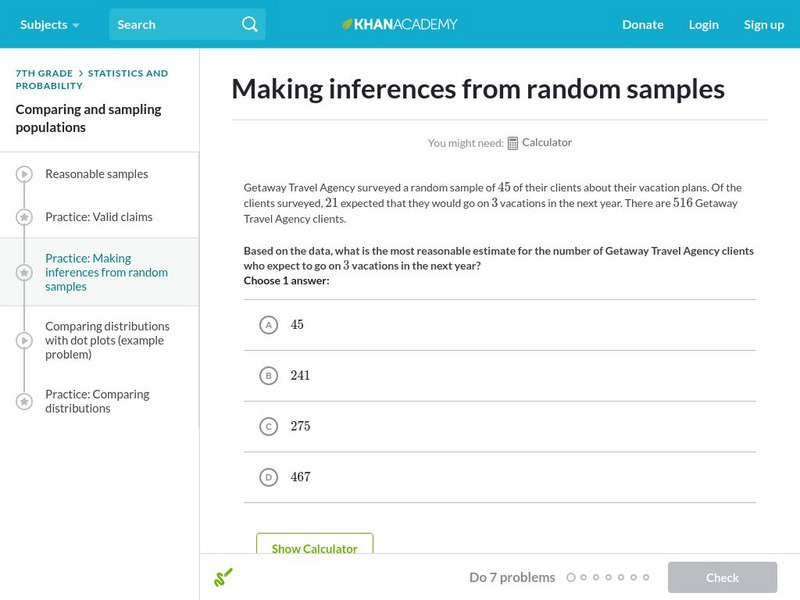
Khan Academy: Making Inferences From Random Samples
Practice making inferences from random samples.
Khan Academy
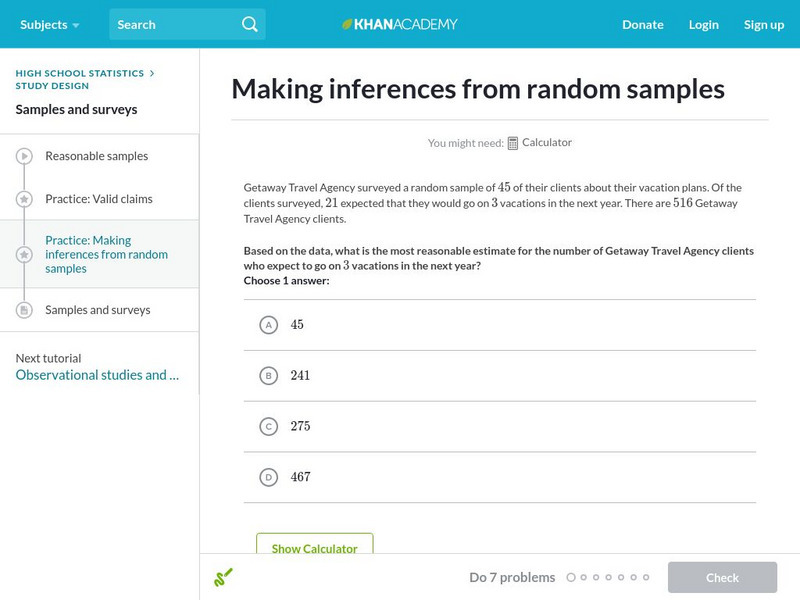
Khan Academy: Making Inferences From Random Samples
Given a random sample, practice figuring out what can we reasonably infer about the entire population? Students receive immediate feedback and have the opportunity to try questions repeatedly, watch a video or receive hints.
PBS
Pbs Learning Media: Estimation From Random Sampling
Practice estimating wildlife population by using the process of random sampling.
Khan Academy
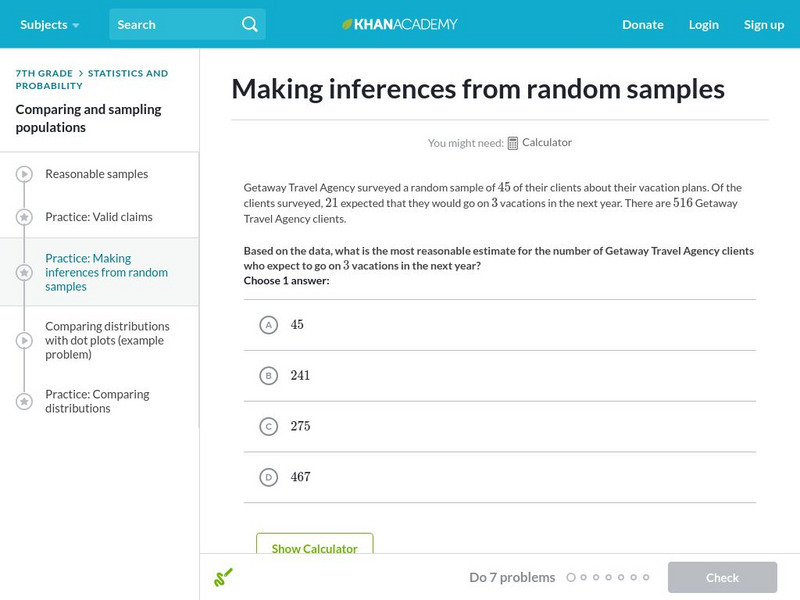
Khan Academy: Making Inferences From Random Samples
Practice making inferences from random samples.
Other
Nearpod: Random Sampling
In this lesson, 7th graders will learn how to use random sampling to make generatlizations and predictions about a population.
Alabama Learning Exchange
Alex: Something's Fishy: A Lesson in Biological Sampling
Determining the population in a larger area by tagging. By using proper scientific method and careful sampling procedures, students learn how biologists work in the field to collect data about a population. Students will also calculate...
CPALMS
Cpalms: Population of Utah
[Free Registration/Login Required] This is a formative assessment task where students are asked to estimate the population of Utah based on information given about its population density and the perimeter of its state boundaries. Samples...
National Council of Teachers of Mathematics
The Math Forum: Probability and Statistics
This page is a math home page that includes information on all topics of probability and statistics.


