Curated OER
Probability Distributions
Students collect and plot data on a graph. In this statistics instructional activity, students analyze the distribution of a sample and predict the outcome. They find the line of best fit and discuss what would make the sample larger.
Noyce Foundation
Fair Game?
The game should be fair at all costs. The mini-assessment revolves around the ability to use probabilities to determine whether a game is fair. Individuals determine compound events to calculate simple probabilities and make long-run...
NY Learns
Investigation - What's in the Bag?
If you have or can create a set of tiles, numbered one through eight, then you can implement this hands-on lesson about probability models. Individuals draw a tile from a bag, record its number, and then return it to the bag. They...
Curated OER
Probability and Expected Value
Students collect data and analyze it. In this statistics lesson, students make predictions using different outcomes of trials.
Curated OER
Math Applications 2
For this probability worksheet, students solve 1 word problem with three different parts to it. First, they find the probability of drawing an ace from a deck of cards. Then, students determine the probability that they will draw an ace...
Curated OER
Finding the Probability
Ninth graders investigate the concept of probability. They use a clear objective that is a visual cue for what is required for the lesson. They apply the basic practices of probability to real life like situations.
Curated OER
Analyze This
Sixth graders use a video and the internet to determine whether a game is fair or unfair. In this probabilities lesson plan, 6th graders determine the fairness of a game based on the probabilities of the outcomes.
Curated OER
What are My Chances?
Students calculate the chance of an event occurring. In this statistics lesson, students use combination and permutation to calculate the probability of an event occurring. They differentiate between theoretical and experimental...
Curated OER
What's in the Bag?
Students calculate the probability of an event occurring. In this statistics lesson, students calculate the outcome using combination and permutation. They differentiate between-theoretical and experimental probability.
Curated OER
Badminton or Basketball?
Students explain why for a group of n people, there are an equal number of possibilities for subgroups of size k (such that k < n) and size n - k.
PBS
Remove One
With a set of 15 chips and a number line, learners predict what sums may occur with the rolling of two dice. When their sum comes up, they remove one of the chips from their number line with the objective of being the first to remove...
Curated OER
Fair Games
Fifth graders examine the statistics of playing games. Many games of chance and activities in maths text books involve rolling two dice and combining the scores, usually by addition. Students often find the probabilities of such events...
Curated OER
Star Cluster Math
In this star cluster math instructional activity, students use four different patterns to solve five problems about the fraction of stars classified by their temperature.
Curated OER
Temperature High and Lows
Young scholars gather high and low temperature readings through email. In this temperature graphing lesson, students use a spreadsheet to input data for a graph. young scholars interpret the graphs to compare and contrast the data from...
Curated OER
How do We Treat Our Environment?
Seventh graders explore the concept of collecting data. In this data collection lesson, 7th graders survey others about their environmental habits. Students graph their data.
Curated OER
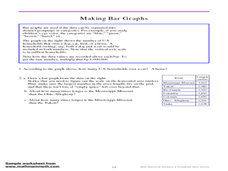
Making Bar Graphs
In this bar graph learning exercise, students answer short answer questions about bar graphs. Students answer 1 question about a bar graph about a cat, and 3 questions about a bar graph about U.S. rivers.


