Curated OER
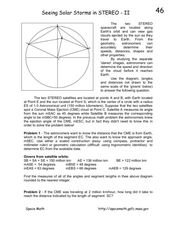
Seeing Solar Storms in STEREO-II
In this solar storms worksheet, students use a diagram given the location of two STEREO spacecraft satellites, a coronal mass ejection, the sun and the Earth to solve 2 problems about the coronal mass ejection. Students use segments,...
Curated OER
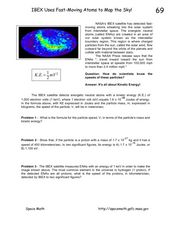
IBEX Uses Fast-Moving Atoms to Map the Sky!
For this energetic neutral atoms worksheet, students solve 3 problems including determining the formula for particle speed, writing the equation to show the relationship between mass, energy and speed and determining the speed of protons...
Curated OER
Changing Perspectives on the Sun's Diameter
In this sun's diameter worksheet, students use a photograph taken by the SOHO satellite of the sun showing a change in diameter from one month to another. Students find the average diameter of the sun, they determine the percent change...
Curated OER
Super-Fast Solar Flares!
In this solar flares worksheet, students observe a sequence of figures of a solar flare observed in 2003 from the Ramaty High Energy Solar Spectroscopic Imager satellite. Students solve 6 problems including finding the scale of each...
Curated OER
A Star Sheds a Comet Tail!
In this comet tails and stars worksheet, students read about the star Mira and the vast clouds of gases it emits. They use a photograph from the Galaxy Evolution Explorer satellite to solve 5 problems about the scale of the image, the...
Curated OER
Hinode Sees Mysterious Solar Micro-Flares
In this solar micro-flares instructional activity, students read about the X-ray bright spots that the Hinode satellite's X-ray Telescope detected on the sun's surface. Students determine the scale of the image, the dimensions of the...
Curated OER
How Big is a Lunar Crater?
For this lunar crater worksheet, learners use an image taken by the Lunar Orbiter spacecraft to find the scale of the image and determine the diameter of the lunar crater Tycho. They also find the size of the smallest and largest...
NOAA
Earth Origami
After reading a brief history of Carl Skalak's journey on the open waters, scholars make a three-dimensional model of the Earth out of an Origami balloon using a printable decorated as the Earth.
Curated OER
Surface Air Temperature Trends of the Caribbean
Students use real satellite data to determine the changes in near-surface air temperature at different times of the year over the Caribbean Sea. They discover how Earth's tilt causes seasonal differences in incoming solar energy. They...
Curated OER
Birds on the Move
Learners observe the migrational path of the Swainson's Hawk from northern Minnesota to the southern portion of South America. They study the migratory path of the hawk and observe how the vegetation in a particular region of the earth...
Curated OER
Aruba Cloud Cover Measured by Satellite
Young scholars analyze cloud cover over Aruba. They compose and submit written conclusions which include data, analysis, errors in data collection, and references.
Scholastic
Study Jams! Severe Storms
Tornadoes and hurricanes and blizzards, oh my! Severe storms are always occurring somewhere on the planet. By reading through these slides, learners discover the characteristics of each type. Have them do this as homework and then take...
Curated OER
Hawk in Flight
Learners use information gathered by satellites to explore the migration of the Swainson's hawk from the western border of Minnesota to the southern portion of South America.
Curated OER
Playground Mapping
Students convert their physical models of a playground from a previous lesson into a map of the playground that includes a scale and key. They examine and discuss examples of maps, view an image to map photo essay, and create a map using...
Curated OER
Forests and Photosynthesis
Fourth graders explore the concept of photosynthesis. They investigate the effects of light on seedlings. Students grow plants and record the data. Students view satellite images that show the monthly amount of vegetation present in the...
Curated OER
"Hard" Data from Space
Students use satellite images to analyze development patterns within Baltimore City. They prepare a land cover map for Baltimore indicating the prevalence of impervious surfaces and explore how these patterns affect water pollution.
Curated OER
Landscape Diversity in the Yukon Territory
Students review and analyze a satellite image of the Yukon territory.
Curated OER
Hurricane Strength: Spatial Association of Wind Speed and Water Temperature
In this hurricane worksheet, students read and analyze satellite images of hurricane Rita. They complete 4 short answer questions about it.
Curated OER
The Bulbs: Camas and Daffodil
Fourth graders become aware of the importance of the camas bulb to the Nez Perce people, they learn the parts of plants, and gain understanding of the interdependence of Nature. They study about the possible causes and outcomes of global...
Curated OER
Do You Have Change?
Students analyze data and complete a worksheet about land use change in a coastal region. In this land use lesson plan, students discuss events that cause land use changes in coastal areas. They construct a change table to summarize data...
Glynn County School System
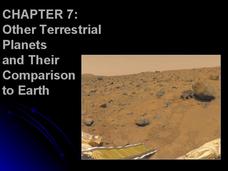
Terrestrial Planets
Mercury, Venus, Earth, and Mars are collectively known as the terrestrial planets. Although part of the same group, each planet has its own set of characteristics. Scholars explore the characteristics that make the planets unique and...
NorthEast Ohio Geoscience Education Outreach
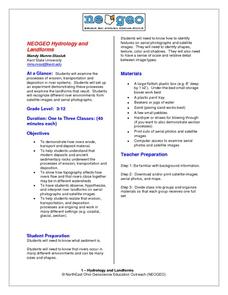
Hydrology and Landforms
Three days of erosion exploration await your elementary geologists. Learners begin by examining rivers via Google Earth, then they model water flow in sand, and finally, they identify resulting landforms. This lesson is written...
Curated OER
Scientist Tracking Network
Students correlate surface radiation with mean surface temperature of several geographic regions. They observe how these parameters change with latitude and construct an understanding of the relationship of solar radiation to seasonal...
Curated OER
Plasmasphere
In this plasmasphere worksheet, students determine how long the plasmasphere takes to rotate around the Earth using two satellite images taken three hours apart.
Other popular searches
- Satellite Imagery
- Hurricane Satellite Images
- Infrared Satellite Imagery
- Image Satellite
- Aerial and Satellite Imagery
- Satellite Images of Erosion
- Science Satellite Imagery
- Satellite Imagery Weather Maps
- Octagonal Image Satellite
