Curated OER
When is Dinner Served? Predicting the Spring Phytoplankton Bloom in the Gulf of Maine (College Level)
Students are able to explain the ecological importance of phytoplankton. They describe the components that influence a phytoplankton bloom. Students interpret satellite images in order to correlate buoy data.
Curated OER
Volcanic Clouds and the Atmosphere
Young scholars examine how scientists monitor volcanoes. In this volcano lesson students complete several activities including why we see things when using satellites.
Curated OER
Sea Surface Temperature Trends of the Gulf Stream
Students explore the importance of the Gulf Stream. Using a NASA satellite images, they examine the sea surface temperature. Students collect the temperature at various locations and times. Using spreadsheet technology, they graph the...
Curated OER
A Journey of Discovery with RXTE
Students complete different missions to examine the topic of x-ray sources. They use satellite images and websites to gather the information they need to complete the lesson. They complete a worksheet to end the lesson.
Curated OER
What Are We Looking At?
Learners investigate different perspectives through a farming simulation. In this photo perspectives lesson plan, students examine different photographs taken by satellite or from ground level. Learners then discuss the differences and...
Curated OER
Images, Empathy, and the Humanitarian Impulse
Students study humanitarian intervention and its role in society. In this politics lesson students view a video on Darfur and discuss what they learned.
Curated OER
Third from the Sun
Students examine images from space. In this third from the Sun lesson plan, students examine images from, Landsat, the satellite launched by NASA in 1972.
Curated OER
Magic Wand
Pupils observe how an image falling on a CCD array is divided into individual pieces, by the property of persistance of vision.
Curated OER
Sensing Somethong
Students are taught that they can gather information about objects using the five senses of vision, touch, smell, taste, and hearing. They are told that some sensing, like sight, is done remotely. Students observe how a camera can...
Curated OER
How Do We Forecast Weather?
Third graders investigate how scientists collect weather data in order to forecast the weather. They work in small groups in order to research one type of weather technology such as, satellite images, radar, surface observations, or...
Curated OER
Jupiter and Io
In this Jupiter and Io worksheet, students use a diagram of the planet and its moon to find the dimension of the image, the width of the largest feature in the atmosphere of Jupiter, the width of the smallest feature in the atmosphere of...
Curated OER
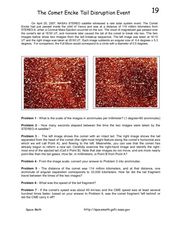
The Comet Encke Tail Disruption Event
In this comet tail disruption instructional activity, learners solve 7 problems using two images from NASA's STEREO satellite showing the breakup of the comet's tail. Students analyze the diagram and use the scale to solve the problems...
Curated OER
The Mathematics of Ion Rocket Engines
In this ion rocket engines learning exercise, students read about how heavy atoms are used to create the thrust in rocket engines. They solve 5 problems including determining the speed of atoms in a satellite, finding the average...
Curated OER
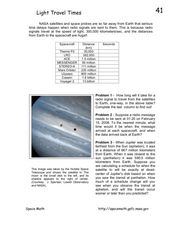
Light Travel Times
In this travel time of light activity, students read about the NASA satellites and space probes that transmit radio signals at the speed of light across huge distances. Students solve 3 problems about data transmission from space to...
Curated OER
Data Corruption by High-Energy Particles
In this data corruption by high-energy particles, students solve 4 problems about the solar flare that corrupted the imagers measuring them. Students find the speed of the arriving particles and the percentage of light-speed the...
Curated OER
Pan's Highway-Saturn's Rings
In this Pan's highway worksheet, students read about the Cassini spacecraft that discovered how Pan clears out the ring debris in the outer A-ring system of Saturn. Students use an image taken by the satellite to find the scale of the...
Curated OER
Ocean Currents and Sea Surface Temperature
Students use satellite data to explore sea surface temperature. They explore the relationship between the rotation of the Earth, the path of ocean current and air pressure centers. After studying maps of sea surface temperature and ocean...
Curated OER
Seeing a Dwarf Planet Clearly: Pluto
In this dwarf planet worksheet, students use images from the Hubble Space Telescope and they determine the scale of the image, they identify the largest features in the images, they calculate the volume of Pluto and they create a model...
Curated OER
Lights, Camera, Action!
Students explore various images and recognize that in order to make a visible image using a camera or using our eye, light is required. In small groups, they observe how the eyes respond to changes in light and record their observations...
Curated OER
Black Holes...V
In this black hole worksheet, students read about the black hole in the center of the Milky Way Galaxy called Sagittarius A and observe a Chandra image of the area where the black hole exists. Students solve two problems which include...
CK-12 Foundation
Location on the Earth: Longitude and Latitude
To what degree do learners understand coordinates? Get them some practice in Yosemite National Park in a simple, fun interactive. Pupils explore a map and locate coordinates of popular sights within the park, then answer questions...
Exploratorium
Hot Spot
Not only does a concave mirror focus light waves, it can also concentrate infrared radiation into a hot spot. If you have a small electric heater and such a mirror, demonstrate this for your physical science class.
Columbus City Schools
Keeping It Hot!
Hot off the presses, this collection of thermal energy activities, lessons, and printables is sure to amaze. Demonstrate how thermal energy moves about in a system using simple materials. Pupils demonstrate their understanding...
NOAA
How Do We Know?: Make Additional Weather Sensors; Set Up a Home Weather Station
Viewers learn about three different weather measurement tools in installment five of the 10-part Discover Your Changing World series. They build weather vanes to collect data on wind speed, barometers to determine air pressure, and...
Other popular searches
- Satellite Imagery
- Hurricane Satellite Images
- Infrared Satellite Imagery
- Image Satellite
- Aerial and Satellite Imagery
- Satellite Images of Erosion
- Science Satellite Imagery
- Satellite Imagery Weather Maps
- Octagonal Image Satellite

