Curated OER
Water & Ice
Students investigate the properties of water. In this states of water activity, students explore how water goes from liquid to solid and back to liquid again. Students use measurement, observation, and communication to describe the change.
Khan Academy
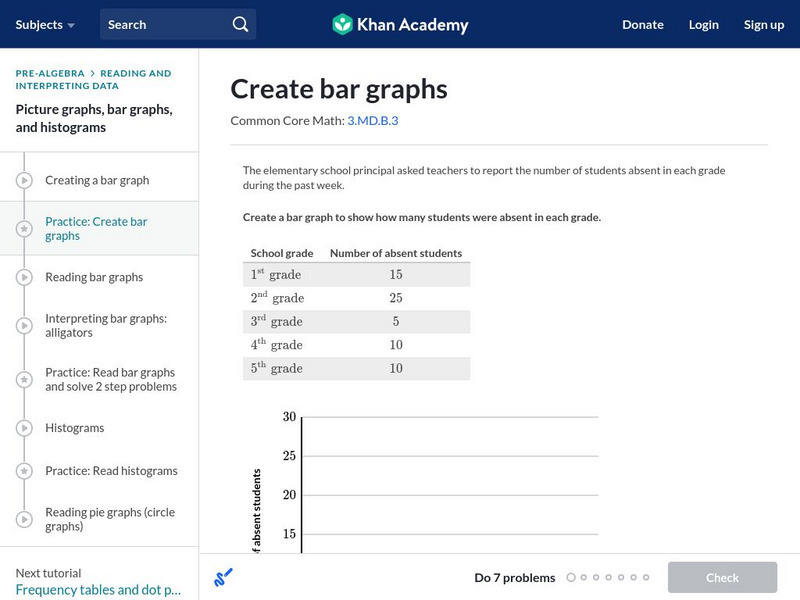
Khan Academy: Create Bar Graphs
Create a bar graph with the data given. Students receive immediate feedback and have the opportunity to try questions repeatedly, watch a video tutorial, or receive hints about creating bar graphs. CCSS.Math.Content.3.MD.B.3 Draw a...
Khan Academy
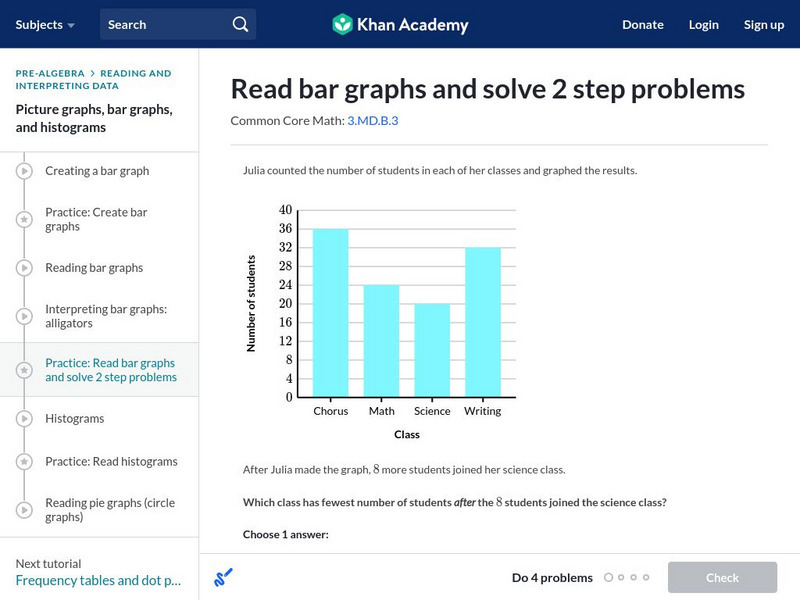
Khan Academy: Read Bar Graphs and Solve 2 Step Problems
Read and interpret a double bar graphs. Students receive immediate feedback and have the opportunity to try questions repeatedly, watch a video or receive hints. CCSS.Math.Content.3.MD.B.3 Draw a scaled picture graph and a scaled bar...
PBS
Pbs Learning Media: Raising the Bar
Harry and Bianca's new boss at a concession stand uses bar graphs to keep records of their refreshment sales in this video from Cyberchase.
Education Place
Houghton Mifflin: Eduplace: Make a Living Bar Graph
Student use simple data to line up in a living bar graph activity when they respond to simple questions in this lesson plan. They physically and visually represent the data. CCSS.Math.Content.3.MD.B.3 Draw a scaled picture graph and a...
Khan Academy
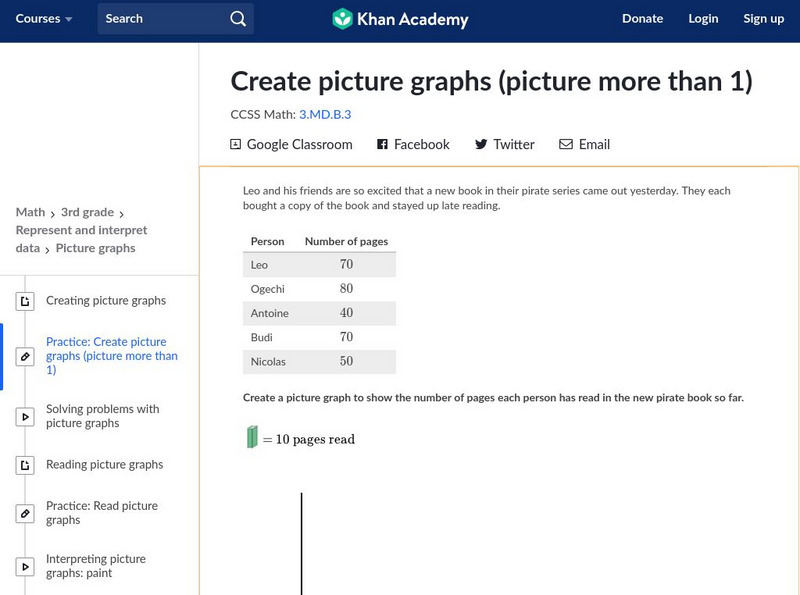
Khan Academy: Create Picture Graphs (Picture More Than 1)
Create and interpret picture graphs. Students receive immediate feedback and have the opportunity to try questions repeatedly, watch a video tutorial, or receive hints about how to create picture graphs. CCSS.Math.Content.3.MD.B.3 Draw a...
Illustrative Mathematics
Illustrative Mathematics: 3.oa, Md, Nbt Classroom Supplies
The purpose of this task is for students to solve problems involving the four operations and draw a scaled picture graph and a scaled bar graph to represent a data set with several categories. Aligns with 3.NBT.A.2;...
Khan Academy
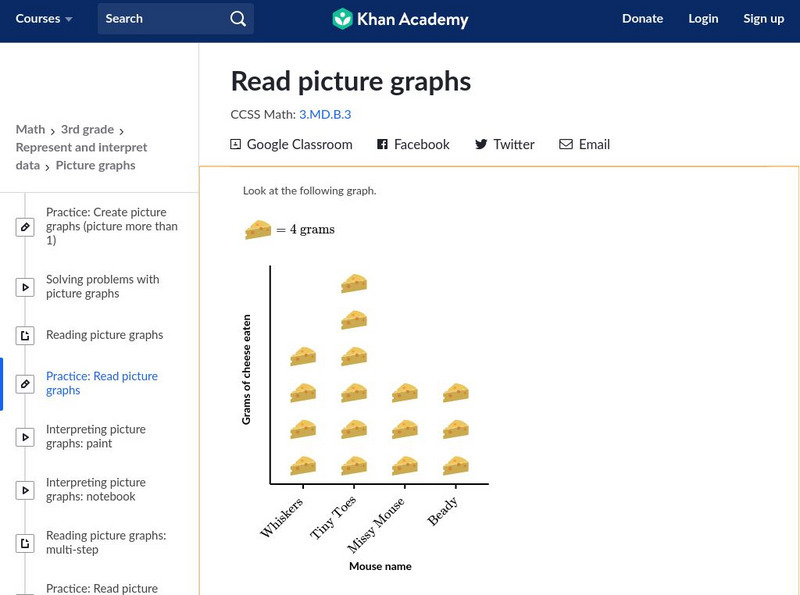
Khan Academy: Read Picture Graphs
Use picture graphs to solve word problems. Students receive immediate feedback and have the opportunity to try questions repeatedly, watch a video or receive hints. CCSS.Math.Content.3.MD.B.3 Draw a scaled picture graph and a scaled bar...
Other
H Twins: The Scale of the Universe 2
Use the scroll bar on this site to zoom in and out of this site which will show you the relative sizes of hundreds of things in our univers, from the smallest currently known - quantum foam - to the largest - our universe. Click on any...
American Forum for Global Education
American Forum for Global Education: A Simple Chocolate Bar
This site is provided for by the American Forum for Global Education. Using a candy bar as a theme, pupils will explore their common link to other "systems on a global scale." Mutual dependence is a key concept taught in this lesson....
University of Texas
Inside Mathematics: Parking Cars [Pdf]
This task challenges a student to use their understanding of scale to read and interpret data in a bar graph.
Science Buddies
Science Buddies: Interpreting Area Data From Maps vs. Graphs
Graphical methods of data presentation are a key feature of scientific communication. This project asks the question, "What's the best way to compare the land area of states: a map or a bar graph?" You'll be measuring performance on two...
Exploratorium
Exploratorium: Microscope Imaging Station: What's the Size of What You See?
In this lesson, you use microscope images to show how to use scale bars to measure very small things.
E-learning for Kids
E Learning for Kids: Math: Elephant Plant: Data and Graphs
On this interactive website students practice various math skills using a real-life scenario involving plants. Those skills include interpreting data in a circle graph, interpreting data in a divided bar graph, and interpreting a bar...
PBS
Pbs Mathline: Sand Babies (Pdf) [Pdf]
For this engaging lesson, students use a variety of measurement strategies in creating their own Sand Babies. Students explore standard and non-standard measurements, area, data collection and analysis, and graphing. Adaptations are...
Louisiana Department of Education
Louisiana Doe: Louisiana Believes: Eureka Math Parent Guide: Problem Solving With Length, Money, and Data
A guide to support parents as they work with their students with problem solving with length, money, and data.
TeachEngineering
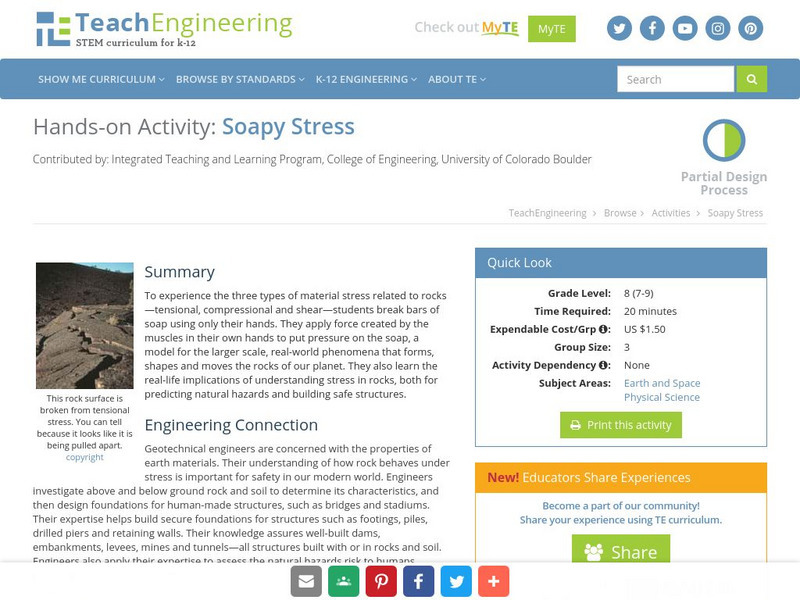
Teach Engineering: Soapy Stress
To experience the three types of material stress related to rocks - tensional, compressional and shear - students break bars of soap using only their hands. They apply force created by the muscles in their own hands to put pressure on...
Texas Instruments
Texas Instruments: Beverage Tests
In this activity, students determine the pH of liquid samples. They get familiar with the pH scale, create graphs comparing pH levels, and compare data displayed as a scatter plot, a boxplot, a histogram, and a bar graph.
Ed Koday
Web Archive: Painted Lady
The upperside of the wings is orange-brown with darker wing bases. The forewing has a black patch and white bar on leading edge, and the hindwing has a row of 5 small black spots and sometimes has blue scales. The underside has a black,...
Other
Stat Soft: Statistics Glossary
Dozens of statistical terms are defined and illustrated in this glossary.
Louisiana Department of Education
Louisiana Doe: Louisiana Believes: Eureka Math Parent Guide: Collecting and Displaying Data
A guide to support parents as they work with their students in collecting and displaying data.
University of Cambridge
University of Cambridge: Nrich: Find the Fake
Find the fake bar of gold in this problem and you are only allowed to use the scale twice. Can you do it? Once you have your solution check this one page website to verify it.


