Illustrative Mathematics
Seeing is Believing
How many visual models can be used to show multiplication? Three basic kinds of models can be used to represent and explain the equation 4 x (9 + 2). The commentary section provides description and graphics to explain the set model,...
Virginia Department of Education
Mathematics Vocabulary Cards - Grade 2
Augment your math curriculum with posters detailing several concepts important to second grade math. Each poster features one math term from geometry, measurement, probability and statistics, computation and estimation, numbers and...
Curated OER
Science Concept Maps
A collection of concept maps has some terms filled in and others left blank for young scientists to fill in. This library can provide you with many pop quizzes for all of your middle to high school science curriculum.
eSkeletons
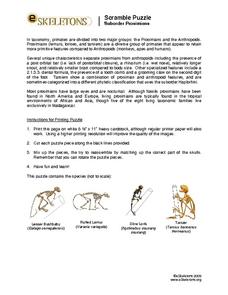
Skeleton Scramble Puzzle: Suborder Prosimians
Explore the finer details of primate skulls with these puzzles, incorporating advanced scientific analysis of two suborders- Prosimians and Anthropoidea- and one superfamily- Hominoidea. Learners read about the unique characteristics of...
Special needs in Music
Music Work Sheet (Special Ed)
Music is beneficial for all learners. Help your learners with special needs learn about different styles of music, as well as the ways that music is represented on paper, with 30 different worksheets.
It's About Time
Volcanic Hazards: Airborne Debris
Pupils interpret maps and graph data related to volcanic ash. Then they analyze the importance of wind speed and the dangers of the ash to both life, air temperature, and technology.
North Carolina Consortium for Middle East Studies
Missing Pieces of the Puzzle: African Americans in Revolutionary Times
What's missing from most studies of the American Revolutionary War is information about the role African Americans played in the conflict. To correct this oversight, middle schoolers research groups like the Black Loyalists and Black...
Curated OER
Tally Time
Students create a tally chart. In this math and health lesson plan, students discuss healthy foods and create a tally chart showing the number of students who like to eat healthy foods.
Curated OER
Plastic Packaging
Students collect data. In this math instructional activity, students collect data about recyclable materials. Students develop a plan that will help the environment. Recycling plastic containers is discussed.
Alabama Learning Exchange
Meteor or Meteorite
Students differentiate between a meteor and meteorite. They participate in an experiment to discover how the size and weight of an object determines the size of the impact crater. They utilize their math skills by measuring with a ruler...
Curated OER
Tulip Graphing
Students create a graph of tulip growth. In this data analysis instructional activity, students plant tulip bulbs and use graph paper to begin graphing data on the growth of the tulip.
Curated OER
ExplorA-Pond: 6th Grade Area and Random Number Tables
Sixth graders estimate surface area of a pond using a random number table.
Curated OER
Building Sets of 13 and 14
Compose and decompose sets of 13 and 14 and compare sets of each with your little learners. They use objects to construct sets of 13 and 14, record their answers, and compare sets in several different ways.
National Security Agency
Line Graphs: Gone Graphing
Practice graphing and interpreting data on line graphs with 36 pages of math activities. With rationale, worksheets, and assessment suggestions, the resource is a great addition to any graphing unit.
Curated OER
Mikrokosomos
In this music activity, students answer twenty questions about Mikrokosomos, Volume IV. For example, "What type of rhythms do the metallophones provide?"
Curated OER
Water on Mars!
In this water on Mars worksheet, students use a diagram to answer four questions about the structures in the image. They find the dimensions of the image, the width of the streams half-way down their flow channels, the smallest feature...
Curated OER
Jazz and Math: Improvisation Permutations
Students explore the various rhythmic combinations in jazz and blues music. They watch a video segment, apply a mathematical formula to calculate the number of possible rhythmic combinations, and perform a combination of notes and...
Curated OER
Climate Change
Young scholars compare weather data and draw conclusions. In this climate change lesson plan, students determine whether data collected over a period of ninety years shows a warming trend.
Curated OER
French Fry Fun: Estimating and Measuring
Third graders demonstrate their estimating and measuring abilities. In this length measurement lesson, 3rd graders produce estimates of how long a handful of French fries will be before physically measuring them. Students graph their...
Curated OER
The Appearance of a Graph
Sixth graders understand that the appearance and increment used on the x and y axis in a graph change how it looks. For this graphing lesson, 6th graders work in pairs and interpret graphs using different axes. Students collect graphs...
Curated OER
Water Wonders
Students experiment with the cohesion of water molecules. In this surface tension lesson, students estimate how many drops of water a full glass can take before overflowing. They watch a video that explains water molecules.
Curated OER
Graphing Pasta
Students sort and graph various types of pasta. Using pasta construction paper patterns or real pasta, they sort the pasta by color, size, and type, and record the data on a graph.
Curated OER
Graphing with Stems-and -Leafs
Fourth graders examine the use of stem and leaf graphs. In this stem and leaf graph activity, 4th graders participate in teacher led activity showing the use of the graphs. They work in groups to collect data about peanuts before making...
Curated OER
Real Misleading Graphs
Students identify real graphs and misleading graphs. In this algebra lesson, students surf the Internet for real life scenarios where graphs are used in a misleading way as well as in a correct way.


