Curated OER
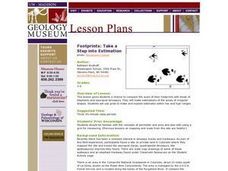
Footprints: Take a Step into Estimation
Compare sizes of student footprints with those of elephants and sauropod dinosaurs! Upper graders make estimations of the areas of irregular shapes; students use grids to make and explain estimates within low and high ranges.
Mathematics Assessment Project
Photographs
Picture your pupils using this assessment task. Class members must first determine the measurements of smaller copies of photographs placed next to the original. They then determine the dimensions of the entire sheet of photographs.
Curated OER
What Is El Niño?
Students access information at remote sites using telecommunications, identify impacts by reviewing past El Ni??o events, make and use scale drawings, maps, and maps symbols to find locations and describe relationships.
Edgate
Great Grids
Learners use grid boxes as a measurement tool and discover how grids are used for mapmaking and scaling down an area. They begin by attempting to draw a model shape drawn by the teacher by using the gridding process. At the conclusion of...
Curated OER
Ratios And Scale
high schoolers investigate the concept of using a ratio in the work of construction and solve problems using real life applications. They read descriptions of how various types of construction professionals use ratios on the job. The...
Curated OER
Scale Basketball
Students discuss scale diagrams and maps as well as the use of spreadsheets to find the best scale to use in a model before practicing scale and ratio problems on their own.
Curated OER
TOPSY TURVY MAPS
Eighth graders use the data analyzer and motion detector to collect data and measure distances. They create topographic maps drawn to scale of a given setup and relate the concepts to the creation of historical ocean maps.
Curated OER
Scale Basketball
Students understand that a spreadsheet can be used to find the best scale to use in a model. They place the distances of the planets of the solar system to the Sun in one column of the spreadsheet. Students try different scales so that...
Curated OER
Problem-Solving Decisions: Reasonable Answers
In this problem solving worksheet, students answer 6 questions pertaining to a story problem about a tabletop scale model of the Nile River.
Curated OER
Mapping with a Compass: A Simulated Survey
Students use compasses and grids to map the locations of artifacts found in a simulated dig site. In groups, they role-play as future archeologists excavating a school site. Groups begin at their assigned datum and site the artifacts...
CK-12 Foundation
CK-12 Middle School Math Concepts - Grade 6
Twelve chapters cover a multitude of math concepts found in the Common Core standards for sixth grade. Each title provides a brief explanation of what you will find inside the chapter—concepts from which you can click on and learn more...
Curated OER
Mush! Tracking Travelers on the Trail
Students get to know Alaska and the Iditarod route that is run by dogs as they track the mushers' progress on a map that they create specifically for the race. They learn about latitude, longitude, plotting on a map, checkpoints, and...
Curated OER
The Pilgrims
Students use distance measuring tools to follow directions and chart the path the pilgrims made from Plymouth, England to Boston, Massachusetts. In this Pilgrim voyage lesson plan, students use a map to chart the distance traveled by the...
Curated OER
Geography Journey
Fourth graders examine the geographic features that define places and regions and answer questions about the state of California. They discuss the components of a map legend and answer worksheet questions using a map of California as a...
Curated OER
Cartography
Students research about cartography and how to be a cartographer. For this math lesson, students draw a map of their classroom. They use a robot to explore navigation using a compass rose.
Curated OER
Home on the Range
Young scholars use maps and mathematics to determine the appropriate panther population in a given area. In this Florida ecology lesson, students research the area requirements of male and female panther and use a map to help calculate...
Noyce Foundation
Photographs
Scaling needs to be picture perfect. Pupils use proportional reasoning to find the missing dimension of a photo. Class members determine the sizes of paper needed for two configurations of pictures in the short assessment task.
Curated OER
Mapping A Stream
Students participate in mapping an actual waterway. They include reach lengths, transects, compass reading, and scale determinations. They include windfalls, plant cover, types of streambed composition, and landmarks such as trees and...
Curated OER
Size Small School
Students explore the concept of scale and ratio. In this scale and ratio instructional activity, students work in groups to measure a given space such as a hallway, office, or gym. Students measure their area using a meter stick. ...
Curated OER
From the Heights to the Depths
Students create a relief map of Asia and Australia. They work in small groups on sections of the map to make one complete map of the continents.
Curated OER
Mapping an Artifact
Students copy a present day artifact onto graph paper. In groups, they decide the scale of the drawing and create the picture using specific graphing points. They are also given photographs in which there are no graphing points and they...
Curated OER
The Tale of Scale
Eighth graders, using a range of data, produce three bar graphs for various scales along the y-axis.
Curated OER
Cookie Topography
Students construct a cross section diagram showing elevation changes on a "cookie island." Using a chocolate chip cookie for an island, they locate the highest point in centimeters on the cookie and create a scale in feet. After tracing...
Mathematics Assessment Project
Linear Graphs
A line is a line is a line. As a middle school assessment task, learners first identify graphs of given linear equations. They then identify the equations that represent real-world situations.
Other popular searches
- Maps Scale Drawing
- Drawing Maps to Scale
- Maps and Scale Drawings
- Maps/scale Drawing Lessons
- Drawing Scale Maps Geography


