Curated OER
Modeling Population Growth
Students create linear, exponential, and quadratic models of U.S. population data to determine which function best represents U.S. population growth. They predict future populations based on each model.
Curated OER
Linear Modelling of the Life Expectancy of Canadians
Middle and high schoolers explore the concept of linear modelling. In this linear modelling instructional activity, pupils find the line of best fit for life expectancy data of Canadians. They compare life expectancies of men and women,...
Curated OER
Building Boxes- Polynimial And Rational Functions
Young scholars investigate the concepts of polynomial and rational functions. They identify the general patterns used to solve problems. The use of real world contexts in the problems helps to promote engagement and understanding of how...
Curated OER
Remembering Our Veterans
Eighth graders research a variety of military statistics while using the theme of Remebering Our Veterans. They use data management to plan and create a PowerPoint presentation with their findings. They incorporate different types of...
Curated OER
Venn Diagram and UK Basketball
Students analyze data and make inferences. In this algebra lesson, students collect and analyze data as they apply it to the real world.
Curated OER
Properties of Logarithms
Learners explore the concept of logarithms. In this logarithms lesson, students discuss the logarithm properties. Learners use linear functions as a basis to develop the logarithm properites by substituting log b and log a for x and y.
Curated OER
Line of Best Fit
Students identify the line of best fit. In this statistics lesson, students collect and analyze data. They calculate the regression equations and identify the different types of correlation.
Curated OER
Analyzing Cubes
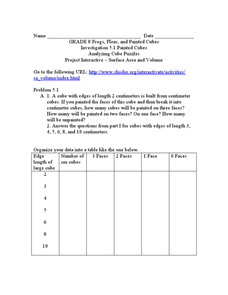
In this analyzing cubes activity, 9th graders solve and complete 6 different types of problems. First, they organize the given data into the table provided. Then, students study the patterns in the table and tell whether the pattern of...
Curated OER
Comparison of Two Different Gender Sports Teams - Part 1 of 3 Measures of Central Tendency
Students gather and analyze data from sports teams. In this measures of central tendency lesson, students gather information from websites about sports team performance. Students analyze and draw conclusions from this data. This lesson...
Curated OER
Conductivity of salt Solutions
Students investigate the concentration level of solutions. In this math/science lesson, students identify three different ionic compounds. They predict the conductivity of each using their collected data.
Curated OER
Proportions in Stories
Learners solve problems dealing with ratios and proportions. In this algebra activity, students rewrite word problems using equations and symbols. They correctly convert between percents and decimals.
Curated OER
Optimization For Breakfast
Students identify he proportion of a cereal box. In this algebra lesson, students define the relationship between patterns, functions and relations. They model their understanding using the cereal box.
Curated OER
Understanding Equations of Functions
Pupils write equations for different functions. In this algebra lesson, students observe data and find the function that goes along with that data. The identify the line of best fit.
Curated OER
Modeling With Quadratics
Young scholars investigate quadratics through word problems. In this algebra lesson, students models the number of registered males in apprenticeship programs. They investigate the transformation of quadratic function on a coordinate plane.
Curated OER
The Hot Dog Stand - An Annual Report
Students run a computer simulation and collect data as they work and use the data to create an annual report for their business. It is desirable for students to do this project individually, but it could be done as a class using a large...
Curated OER
TV Viewing
Students test a hypothesis to see if there is a direct correlation between number of hours of TV viewing and academic grade. They collect and compile data to enter on a spreadsheet and create a word processing document supporting their...
Curated OER
What Can Scatterplots Tell Us?
Eighth graders use data from surveys conducted with parents, peers and themselves to create computer-generated scatterplots. They make inferences from their scatterplots.
Curated OER
A Statistical Look at Jewish History
Students complete their examination over the Jewish Diaspora. Using population figures, they discover the importance of percentages in exploring trends. They use their own ethnic group and determine how it is represented in the United...


