Hi, what do you want to do?
Curated OER
Rotation Sensor Challenge
Learners participate in a challenge to construct a rotation sensor with the highest degree of accuracy and repeatability. They conduct computer analysis of their sensor using repeated trial.
Curated OER
Capturing the Wind
Students collect and analyze data about wind speed. They build a Lego wind sail and measure the wind speed with a rotation sensor. They use software to analyze the data.
Curated OER
M&M Exponential Activity
Students create a scatter plot of their experimental data. In this algebra instructional activity, students use M&M's to determine an algebraic model. They discuss results in class.
Curated OER
The Big E
Sixth graders explore predictions and estimation. In this math lesson, 6th graders analyze data and make predictions based on the past years data.
Curated OER
MOBILITY, Traveling Lightly: What’s My Footprint?
Students calculate their carbon footprint. In this environmental technology lesson, students listen to a lecture on climate change. Students brainstorm solutions to reduce environmental impact based on travel options. Students calculate...
Texas Education Agency
Texas Gateway: Interpreting Scatterplots
Given scatterplots that represent problem situations, the student will determine if the data has strong vs weak correlation as well as positive, negative, or no correlation.
TeachEngineering
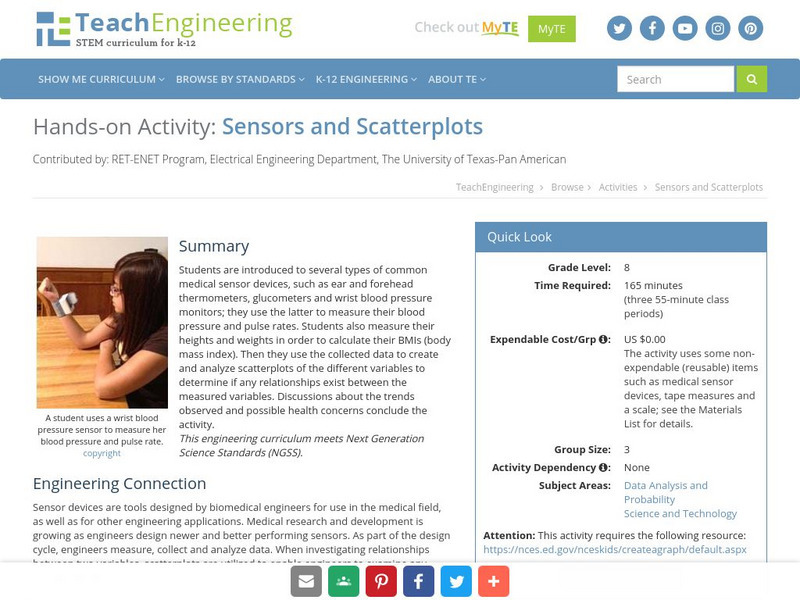
Teach Engineering: Sensors and Scatterplots
Students explore the use of several biomedical engineering sensor devices, and then use the collected data to create and analyze scatterplots of the different variables to determine if any relationships exist between the measured...
Other
Nearpod: Scatterplots, Correlation & Lines of Best Fit
In this lesson on scatterplots, students will learn how to create the line of best fit and analyze scatterplots by learning about correlations and causation.
Texas Instruments
Texas Instruments: Scatterplots and Correlation With Ti 83
Students learn how to enter a list of data and use these lists to graph two-variable statistics. They learn how to analyze the resulting scatterplots to assess the correlation between two variables.
Texas Education Agency
Texas Gateway: Analyzing Scatterplots
Given a set of data, the student will be able to generate a scatterplot, determine whether the data are linear or non-linear, describe an association between the two variables, and use a trend line to make predictions for data with a...
Khan Academy
Khan Academy: Scatterplots and Correlation Review
A scatterplot is a type of data display that shows the relationship between two numerical variables. Each member of the dataset gets plotted as a point whose x-y coordinates relates to its values for the two variables.
Khan Academy
Khan Academy: Describing Scatterplots (Form, Direction, Strength, Outliers)
Description and example of a scatter plot.
Khan Academy
Khan: Lsn 8: Interpreting Relationships in Scatterplots/graphs/tables/equations
This lesson focuses on Interpreting and analyzing linear, quadratic, and exponential models and graphs. Students will use best fit lines to interpret contexts, distinguish whether contexts are linear or exponential functions, use the...
Texas Instruments
Texas Instruments: Scatterplots and Correlation With Ti 89
Students input data relating the values of one variable associated with values of another and use these data to generate a scatterplot. From the scatterplot, they determine whether there is a correlation between the two variables and...
Scholastic
Scholastic: Shake, Rattle & Roll
Students will learn and reinforce skills for creating and analyzing scatterplots and histograms; using cost-benefit analysis to make predictions from data and using tree diagrams to understand outcomes of events.
Purple Math
Purplemath: Scatterplots and Regressions
Explains the purpose of scatterplots, and demonstrates how to draw them.
PBS
Pbs Teachers: Weather: Rainfall
Create and use scatterplots based on information from a table, and compare and contrast annual rainfall in various places around the world.
McGraw Hill
Glencoe Mathematics: Online Study Tools: Self Check Quiz on Linear Functions
The online assessment demonstrates knowledge of advanced mathematical concepts in Algebra II. The questions test students on linear functions. Topics include modeling real-world data with linear functions, scatterplots, and regression...
Colorado State University
Colorado State Writing Center: Charts
The use of charts and graphs can improve your presentations, whether on paper or as visual aids. Here you can read about how to create line, column, bar, pie graphs, and scatterplots. Just follow the links to their respective pages.
CK-12 Foundation
Ck 12: Scatter Plots and Linear Correlation Grades 11 12
[Free Registration/Login may be required to access all resource tools.] This Concept introdices scatterplots and linear correlation for bivariate data.
National Council of Teachers of Mathematics
Nctm: Illuminations: Advanced Data Grapher
The Advanced Data Grapher can be used to analyze data with box plots, bubble graphs, scatterplots, histograms, and stem-and-leaf plots.
Khan Academy
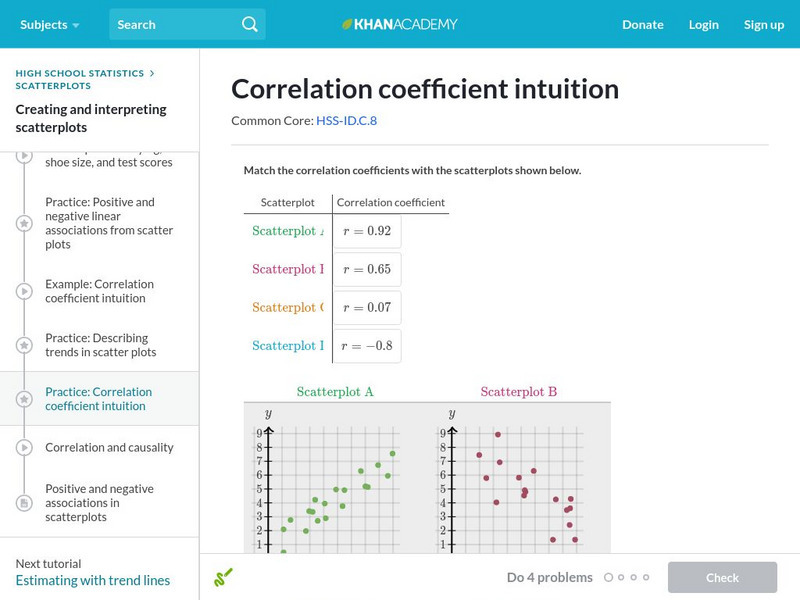
Khan Academy: Correlation Coefficient Intuition
Match correlation coefficients to scatterplots to build a deeper intuition behind correlation coefficients. Students receive immediate feedback and have the opportunity to try questions repeatedly, watch a video or receive hints.
Scholastic
Scholastic: Cultivating Data
Students will understand key concepts of data analysis and their graphic representations. Students will construct and interpret data tables, line plots, box-and-whisker plots and stem-and-leaf plots, scatterplots with line of best fit,...
Texas Instruments
Texas Instruments: Math Today More Students Apply Early
In this activity students will explore scatterplots and independent and dependent variables. Students will find the mean value of the number of students applying under the early decision plan.
Other popular searches
- Scatterplots and Correlation
- Interpreting Scatterplots
- Create Scatterplots
- Algebra 2 Scatterplots
- Drawing Scatterplots
- Explaining Scatterplots
- Scatterplots Heart
- Pre Algebra Scatterplots
- "Algebra 2" Scatterplots
- Algebra 2" Scatterplots


