Hi, what do you want to do?
Rice University
Hyper Stat Online Statistics Textbook: Chapter 3: Describing Bivariate Data
This chapter of an online textbook begins with a description of scatterplots, then focuses on the Pearson Product Moment Correlation.
Alabama Learning Exchange
Alex: My Peanut Butter Is Better Than Yours!
The students will engage in the process of statistical data comparing data using tables and scatterplots. The students will compare data using measures of center (mean and median) and measures of spread (range). This lesson can be done...
Illustrative Mathematics
Illustrative Mathematics: S Id.6 Used Subaru Foresters
Help Jane sell her Forrester! Using the data given, students will make an appropriate plot with well-labeled axes that would allow you to see if there is a relationship between price and age and between price and mileage. Students are...
CK-12 Foundation
Ck 12: Statistics: Least Squares Regression
[Free Registration/Login may be required to access all resource tools.] This Concept introduces students to least-squares regression.
PBS
Pbs Teachers: In a Heartbeat [Pdf]
Apply knowledge of scatter plots to discover the correlation between heartbeats per minute before and after aerobic exercise.
PBS
Pbs Teachers: Sports and Math: Will Women Athletes Ever Catch and Surpass
Explore, explain and make conclusions based on graphs of scatter plots of the Olympic records for men and women in the same event over the same years. Plot x- and y-values, and create linear equations from the data.
Khan Academy
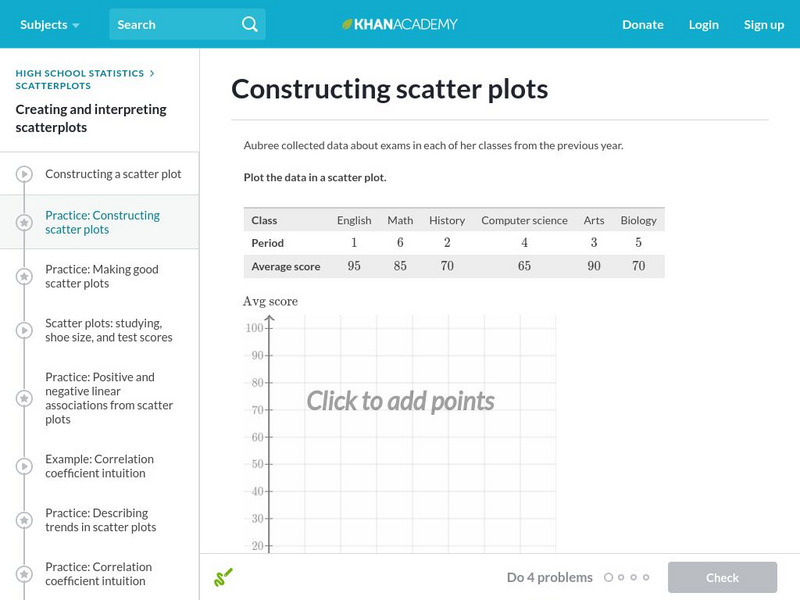
Khan Academy: Constructing Scatter Plots
Practice plotting points to construct a scatter plot. Students receive immediate feedback and have the opportunity to try questions repeatedly, watch a video, or receive hints.
Khan Academy
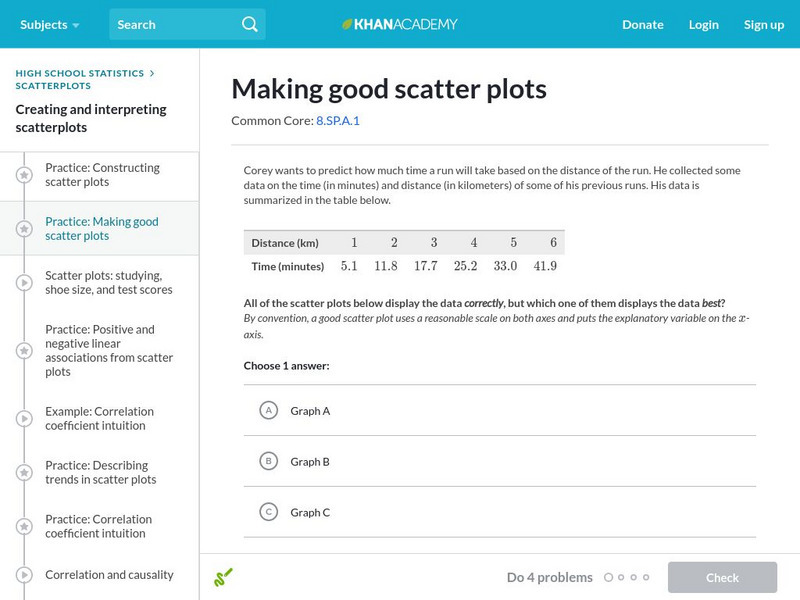
Khan Academy: Making Good Scatter Plots
A good scatter plot has the independent variable on the x-axis and the dependent variable on the y-axis. Also, the scale of both axes should be reasonable, making the data as easy to read as possible. In these practice problems, we...
Khan Academy
Khan Academy: Estimating Slope of Line of Best Fit
Given a scatter plot, can you estimate the slope of the line of best fit that goes through the data points? Students receive immediate feedback and have the opportunity to try questions repeatedly, watch a video, or receive hints.
Khan Academy
Khan Academy: Interpreting Slope and Y Intercept of Lines of Best Fit
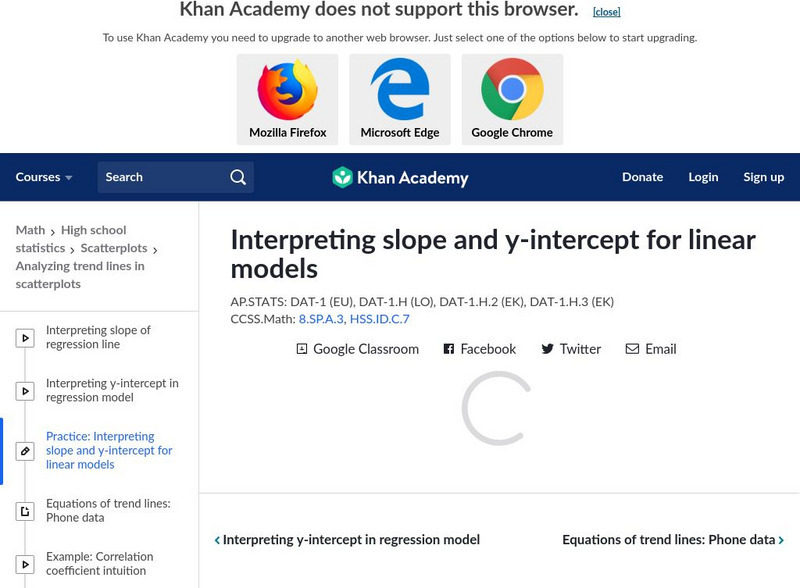
Practice explaining the meaning of slope and y-intercept for lines of best fit on scatter plots. Students receive immediate feedback and have the opportunity to try questions repeatedly, watch a video, or receive hints.
Khan Academy
Khan Academy: Correlation Coefficient Review
The correlation coefficient r measures the direction and strength of a linear relationship. Calculating r is pretty complex, so we usually rely on technology for the computations. We focus on understanding what r says about a scatterplot.
Other popular searches
- Scatterplots and Correlation
- Interpreting Scatterplots
- Create Scatterplots
- Algebra 2 Scatterplots
- Drawing Scatterplots
- Explaining Scatterplots
- Scatterplots Heart
- Pre Algebra Scatterplots
- "Algebra 2" Scatterplots
- Algebra 2" Scatterplots


