Hi, what do you want to do?
Texas Instruments
Texas Instruments: Scatterplots and Correlation With Ti 89
Students input data relating the values of one variable associated with values of another and use these data to generate a scatterplot. From the scatterplot, they determine whether there is a correlation between the two variables and...
Texas Instruments
Texas Instruments: Scatterplots and Correlation With Ti 83
Students learn how to enter a list of data and use these lists to graph two-variable statistics. They learn how to analyze the resulting scatterplots to assess the correlation between two variables.
CK-12 Foundation
Ck 12: Scatter Plots and Linear Correlation Grades 11 12
[Free Registration/Login may be required to access all resource tools.] This Concept introdices scatterplots and linear correlation for bivariate data.
Khan Academy
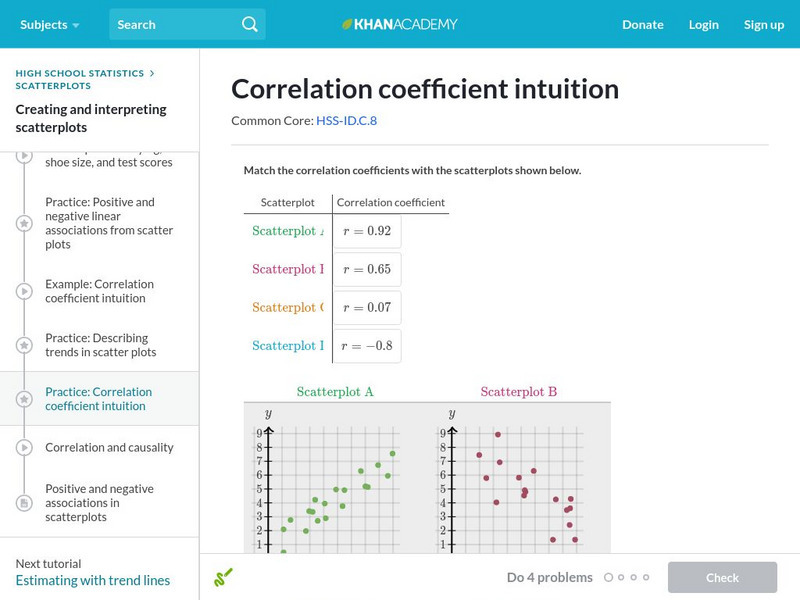
Khan Academy: Correlation Coefficient Intuition
Match correlation coefficients to scatterplots to build a deeper intuition behind correlation coefficients. Students receive immediate feedback and have the opportunity to try questions repeatedly, watch a video or receive hints.
Other
Nearpod: Scatterplots, Correlation & Lines of Best Fit
In this lesson on scatterplots, students will learn how to create the line of best fit and analyze scatterplots by learning about correlations and causation.


